

8 agents. Over 2,000 grocery stores. More than 1,500 customer requests a day — and customers waiting six days just for a reply. No automation. All during the peak of COVID.
As Lead Designer at Ahold Delhaize (Peapod Digital Labs), I was tasked with transforming a support system that was losing customers and crushing conversion into a Doordash competitor.
The Problem
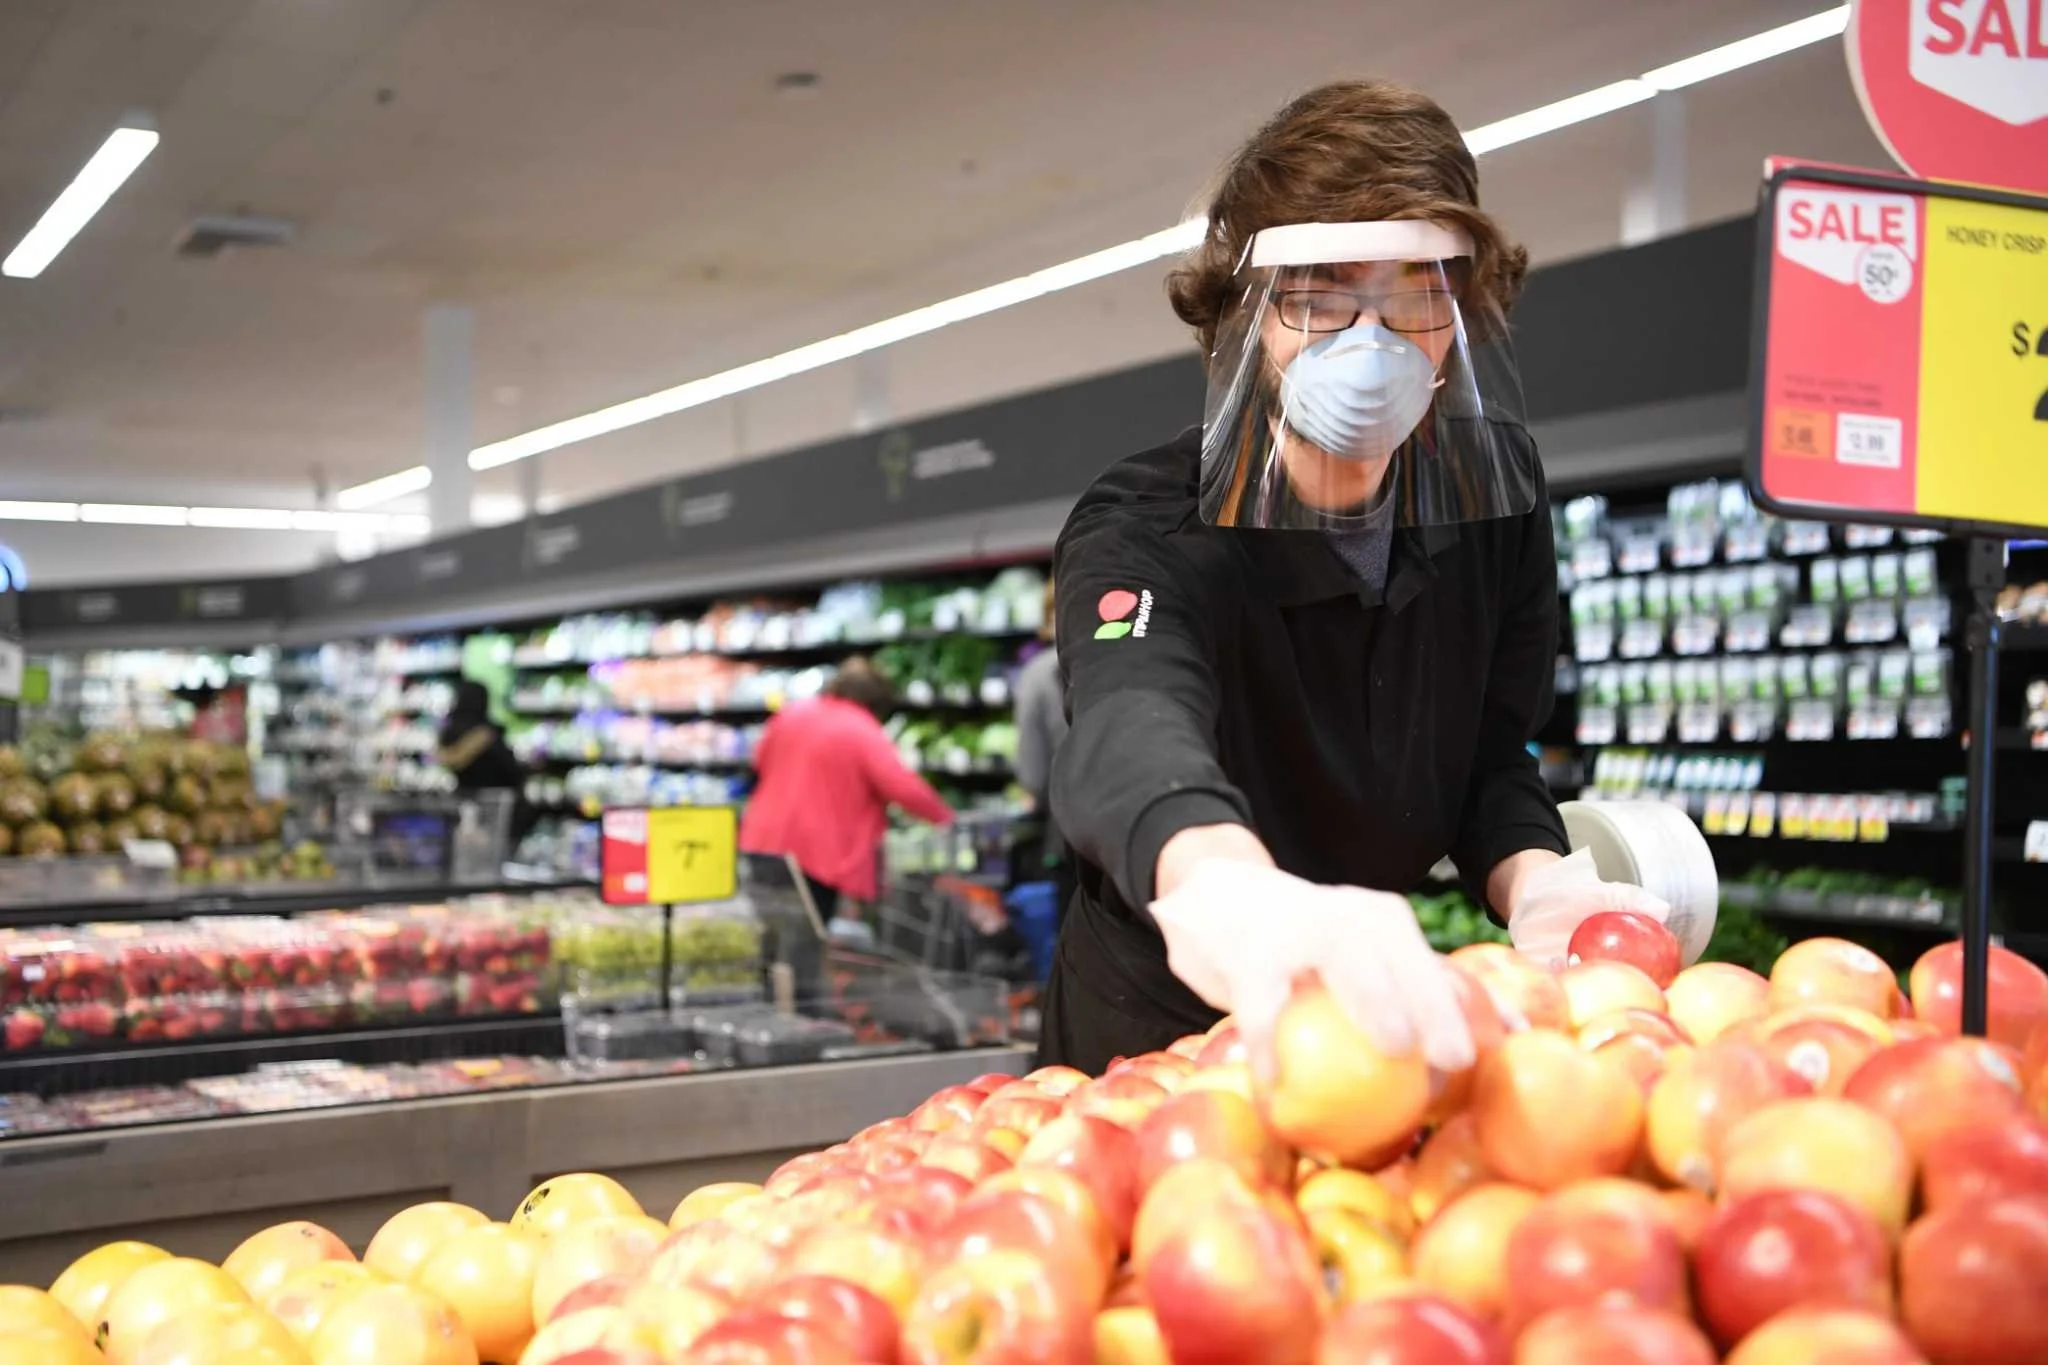
When I joined Ahold Delhaize, their customer care was running on empty. Eight agents covered support for over 2,000 stores—handling more than 1,500 requests a day. Customers waited up to six days for help. There was no automation, no scale, and the pandemic only magnified every flaw.
The result? A support system so outdated it left customers stranded, agents exhausted, and conversion rates in sharp decline.

Delays
Support tickets took an average of 2.5 weeks to complete.
Agents routinely worked 12-hour days, overwhelmed.
Support center buckled under daily volume.
Customer Dropoff
-12% conversion in free fall, driven by unresolved issues and abandoned support tickets
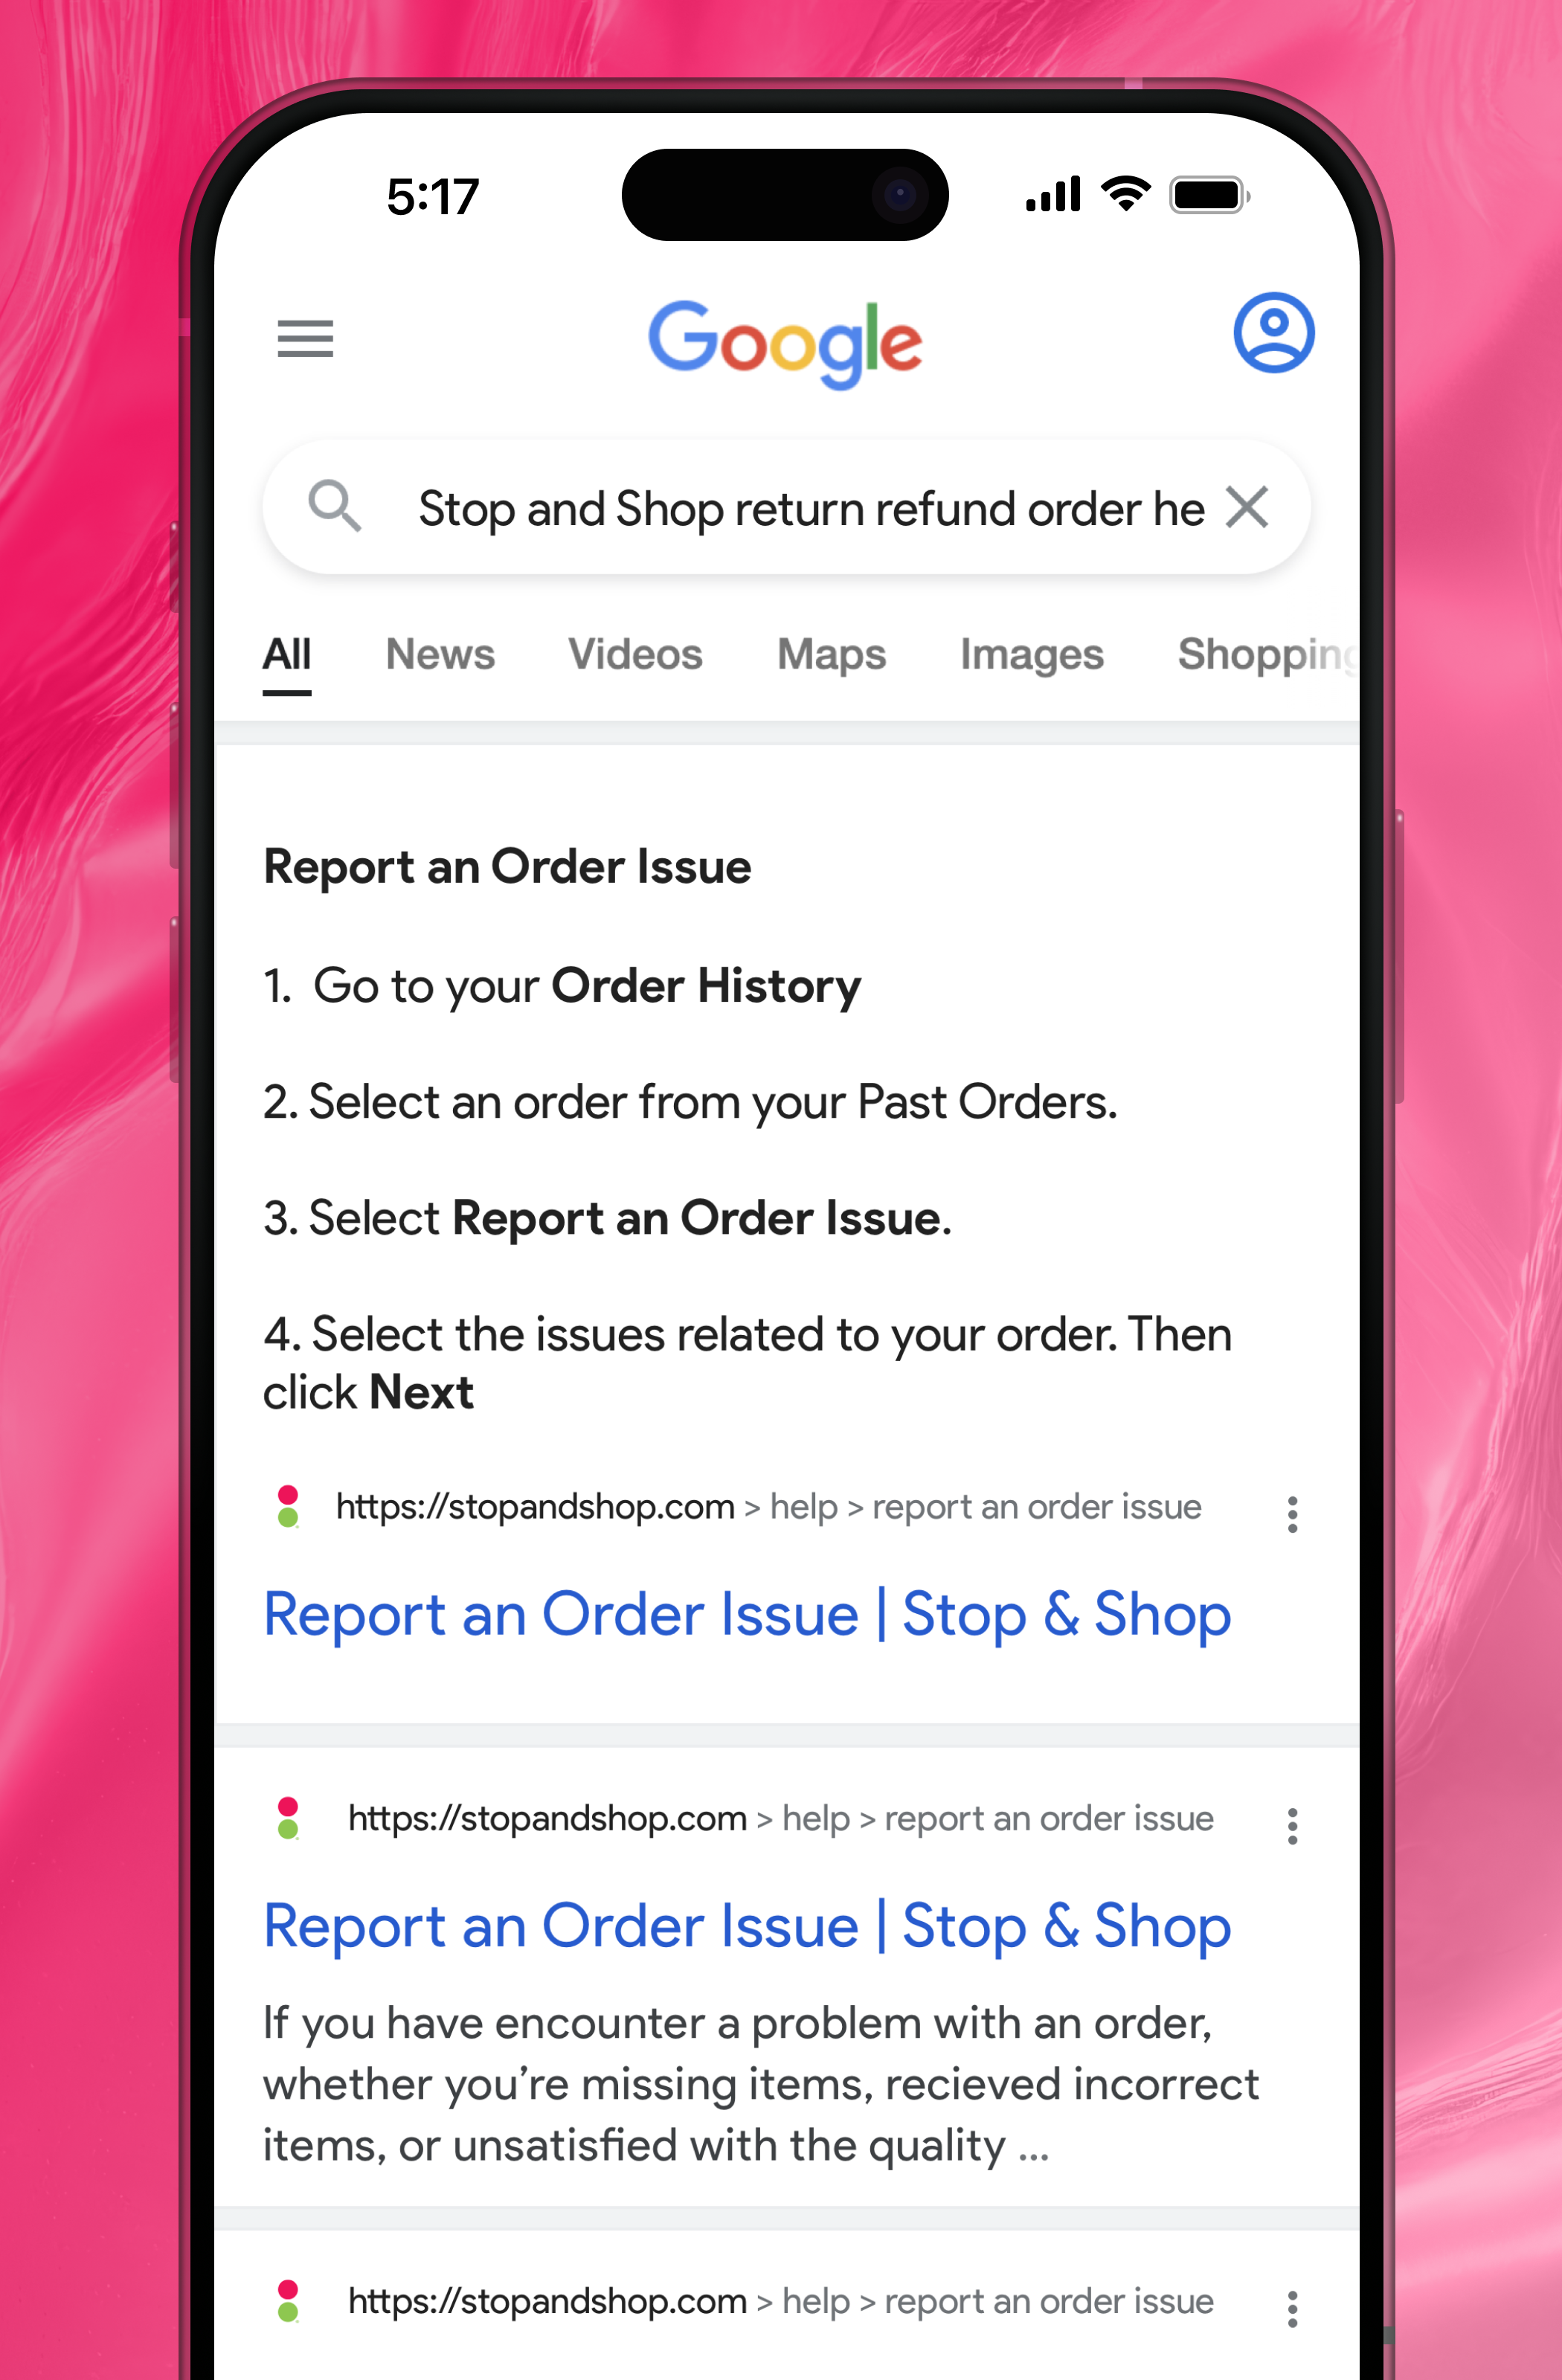
No SEO or scrapability—customers couldn’t find help and they couldn’t search for it on Google.
Call volume was so overwhelming, the customer support phone number was removed from all 2,000+ grocery store websites.
Stuck in the Past
No automation for returns, replacements, or common issues.
Customer care UX was nonexistent and outdated.
Agents managed everything manually, with little data support.
This system wasn’t just outdated and stale—it was rotten.
Customers couldn’t get answers. Agents couldn’t keep up.
Ahold Delhaize needed support as fresh as their delivery.
So I stepped in.
Approach
I partnered closely with Customer Care, Strategy, and a team of 5 dedicated researchers.
Together, we engaged directly with over 100 customers — including high-value shoppers who had switched to competitors — mapping every pain point with a focus on digital journeys and service breakdowns.
Competitive Benchmarking
We conducted a detailed analysis of Ahold Delhaize’s key competitors alongside leading e-commerce brands, applying Baymard Institute methods to establish best-in-class UX standards and uncover gaps in our customer experience.
Customer Validation
Prototypes and ideas were tested with a diverse cross-section of users, ensuring our solutions addressed real-world needs across income levels and varied shopping habits.
Iterative Prototyping
I led the build and refinement of three targeted solutions: a reimagined Customer Care Center, an automated returns experience, and an accessible, A11y-compliant support journey. Each prototype evolved through weekly cycles of hands-on user feedback.
Business Alignment
We paired customer insights with Ahold Delhaize’s business goals to validate both value and scalability — making sure our recommendations met the needs of shoppers and stakeholders before scaling up.

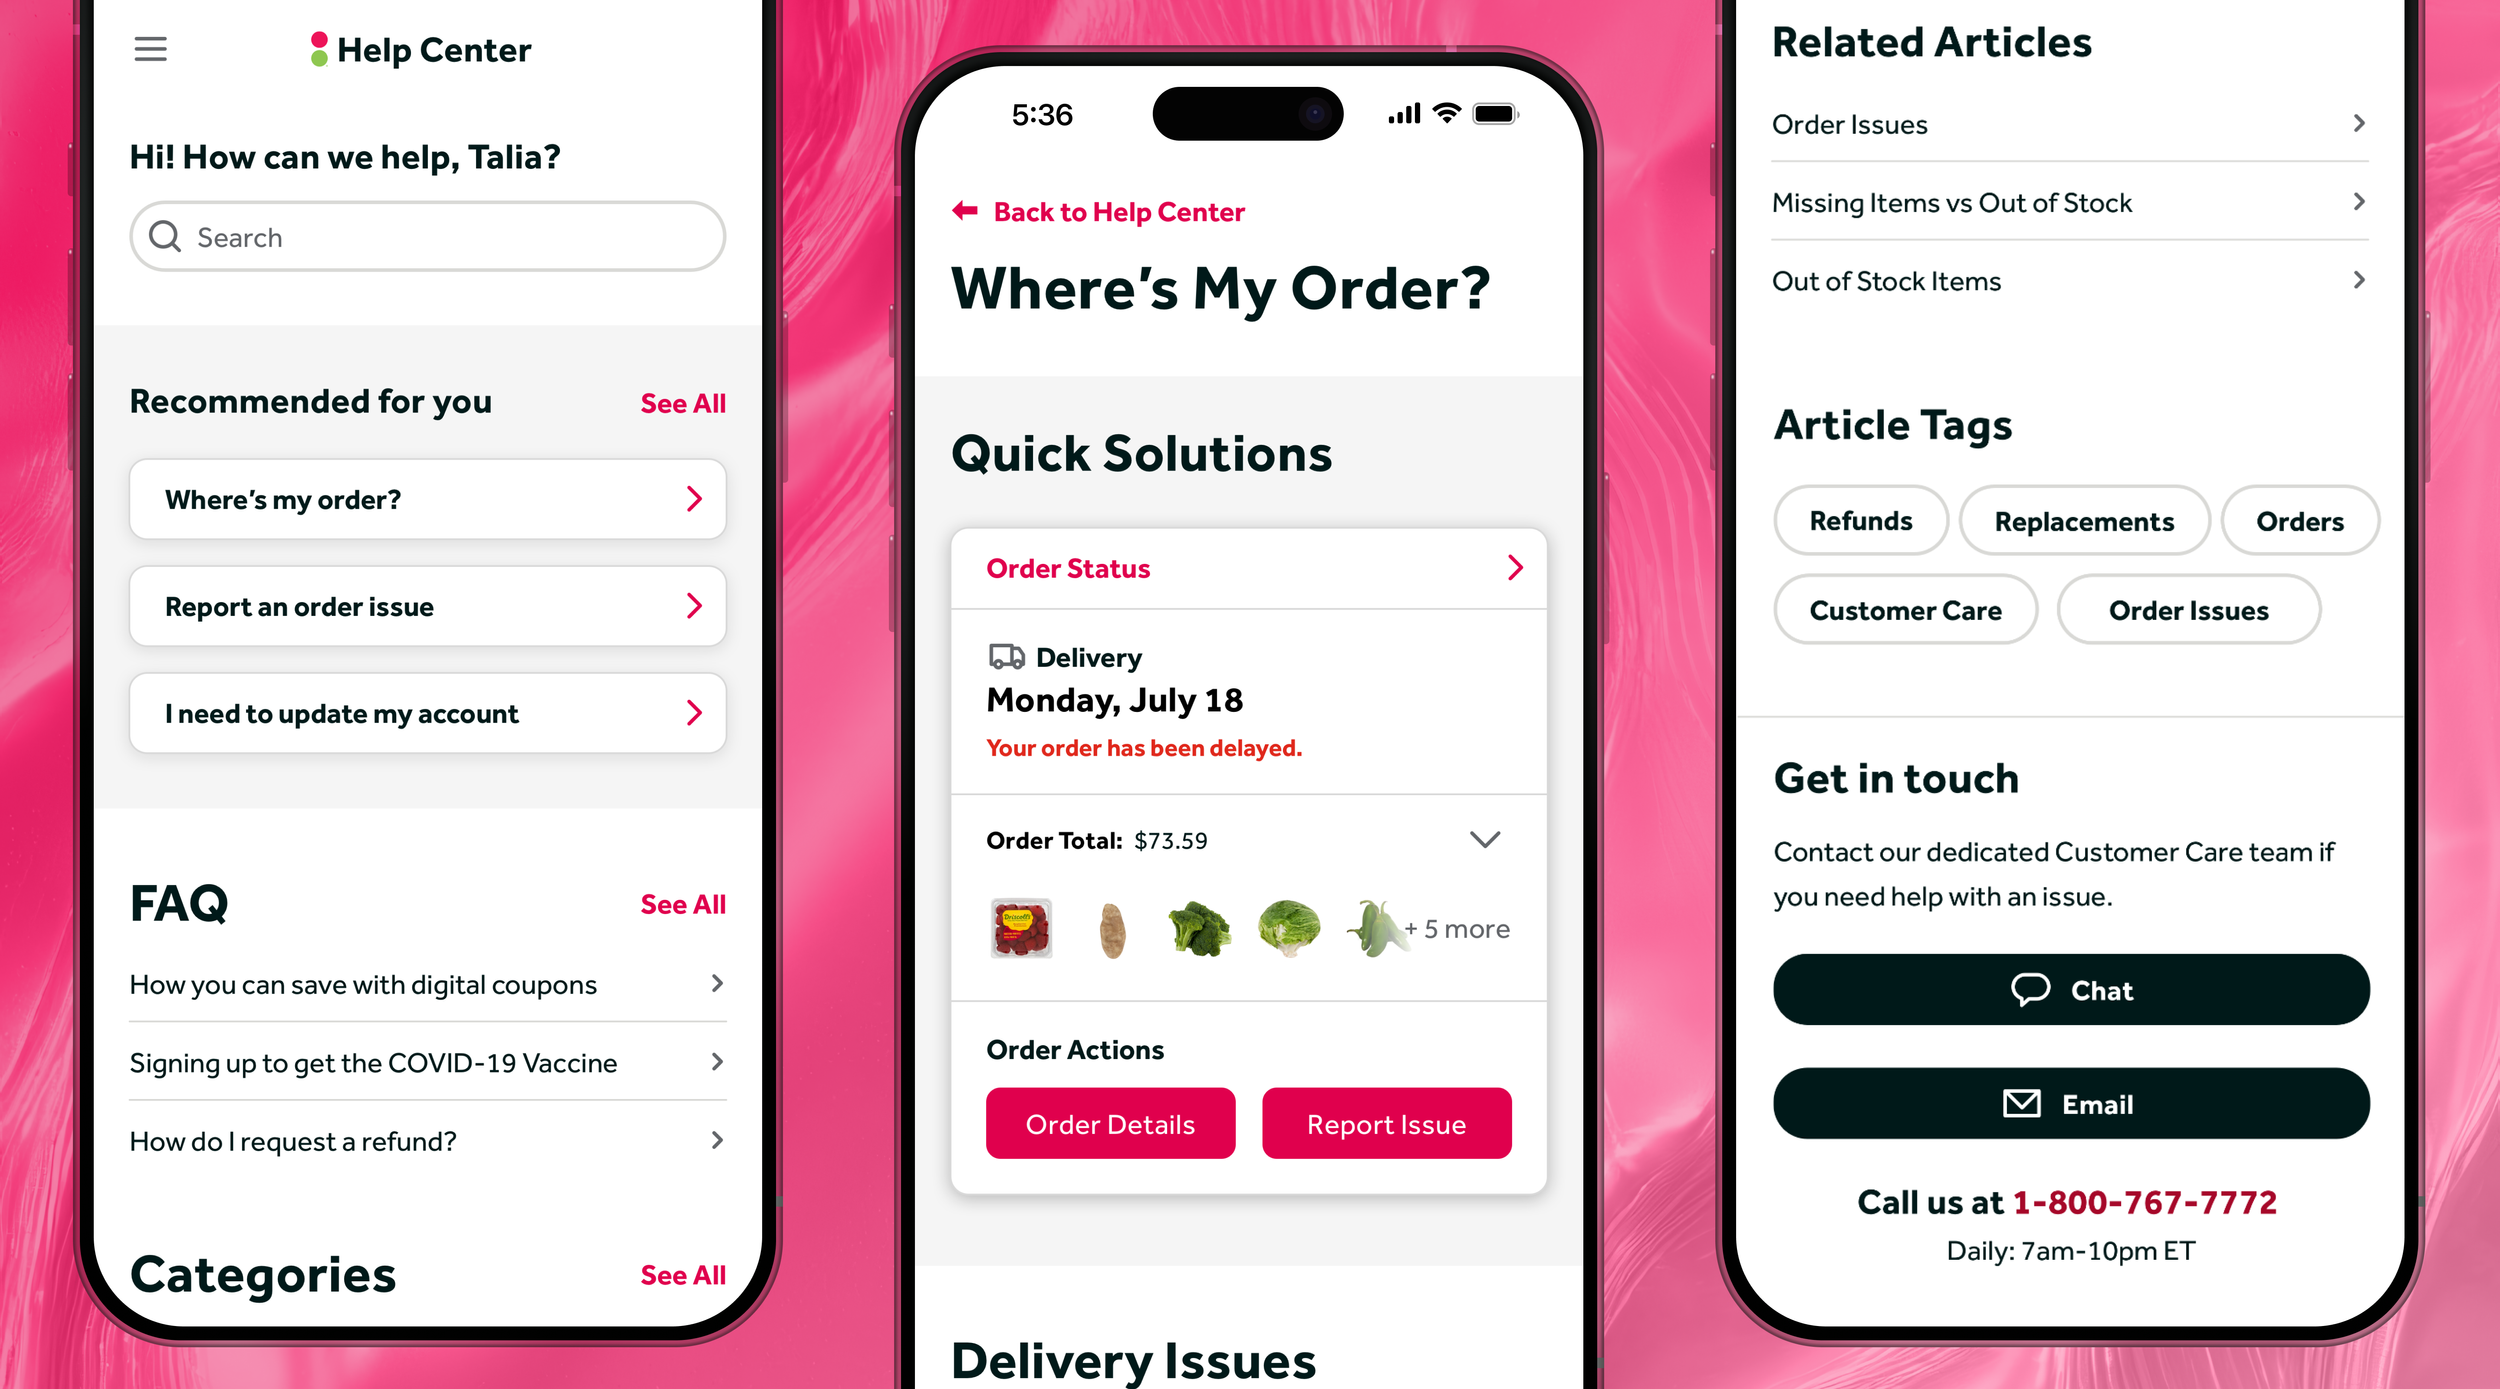
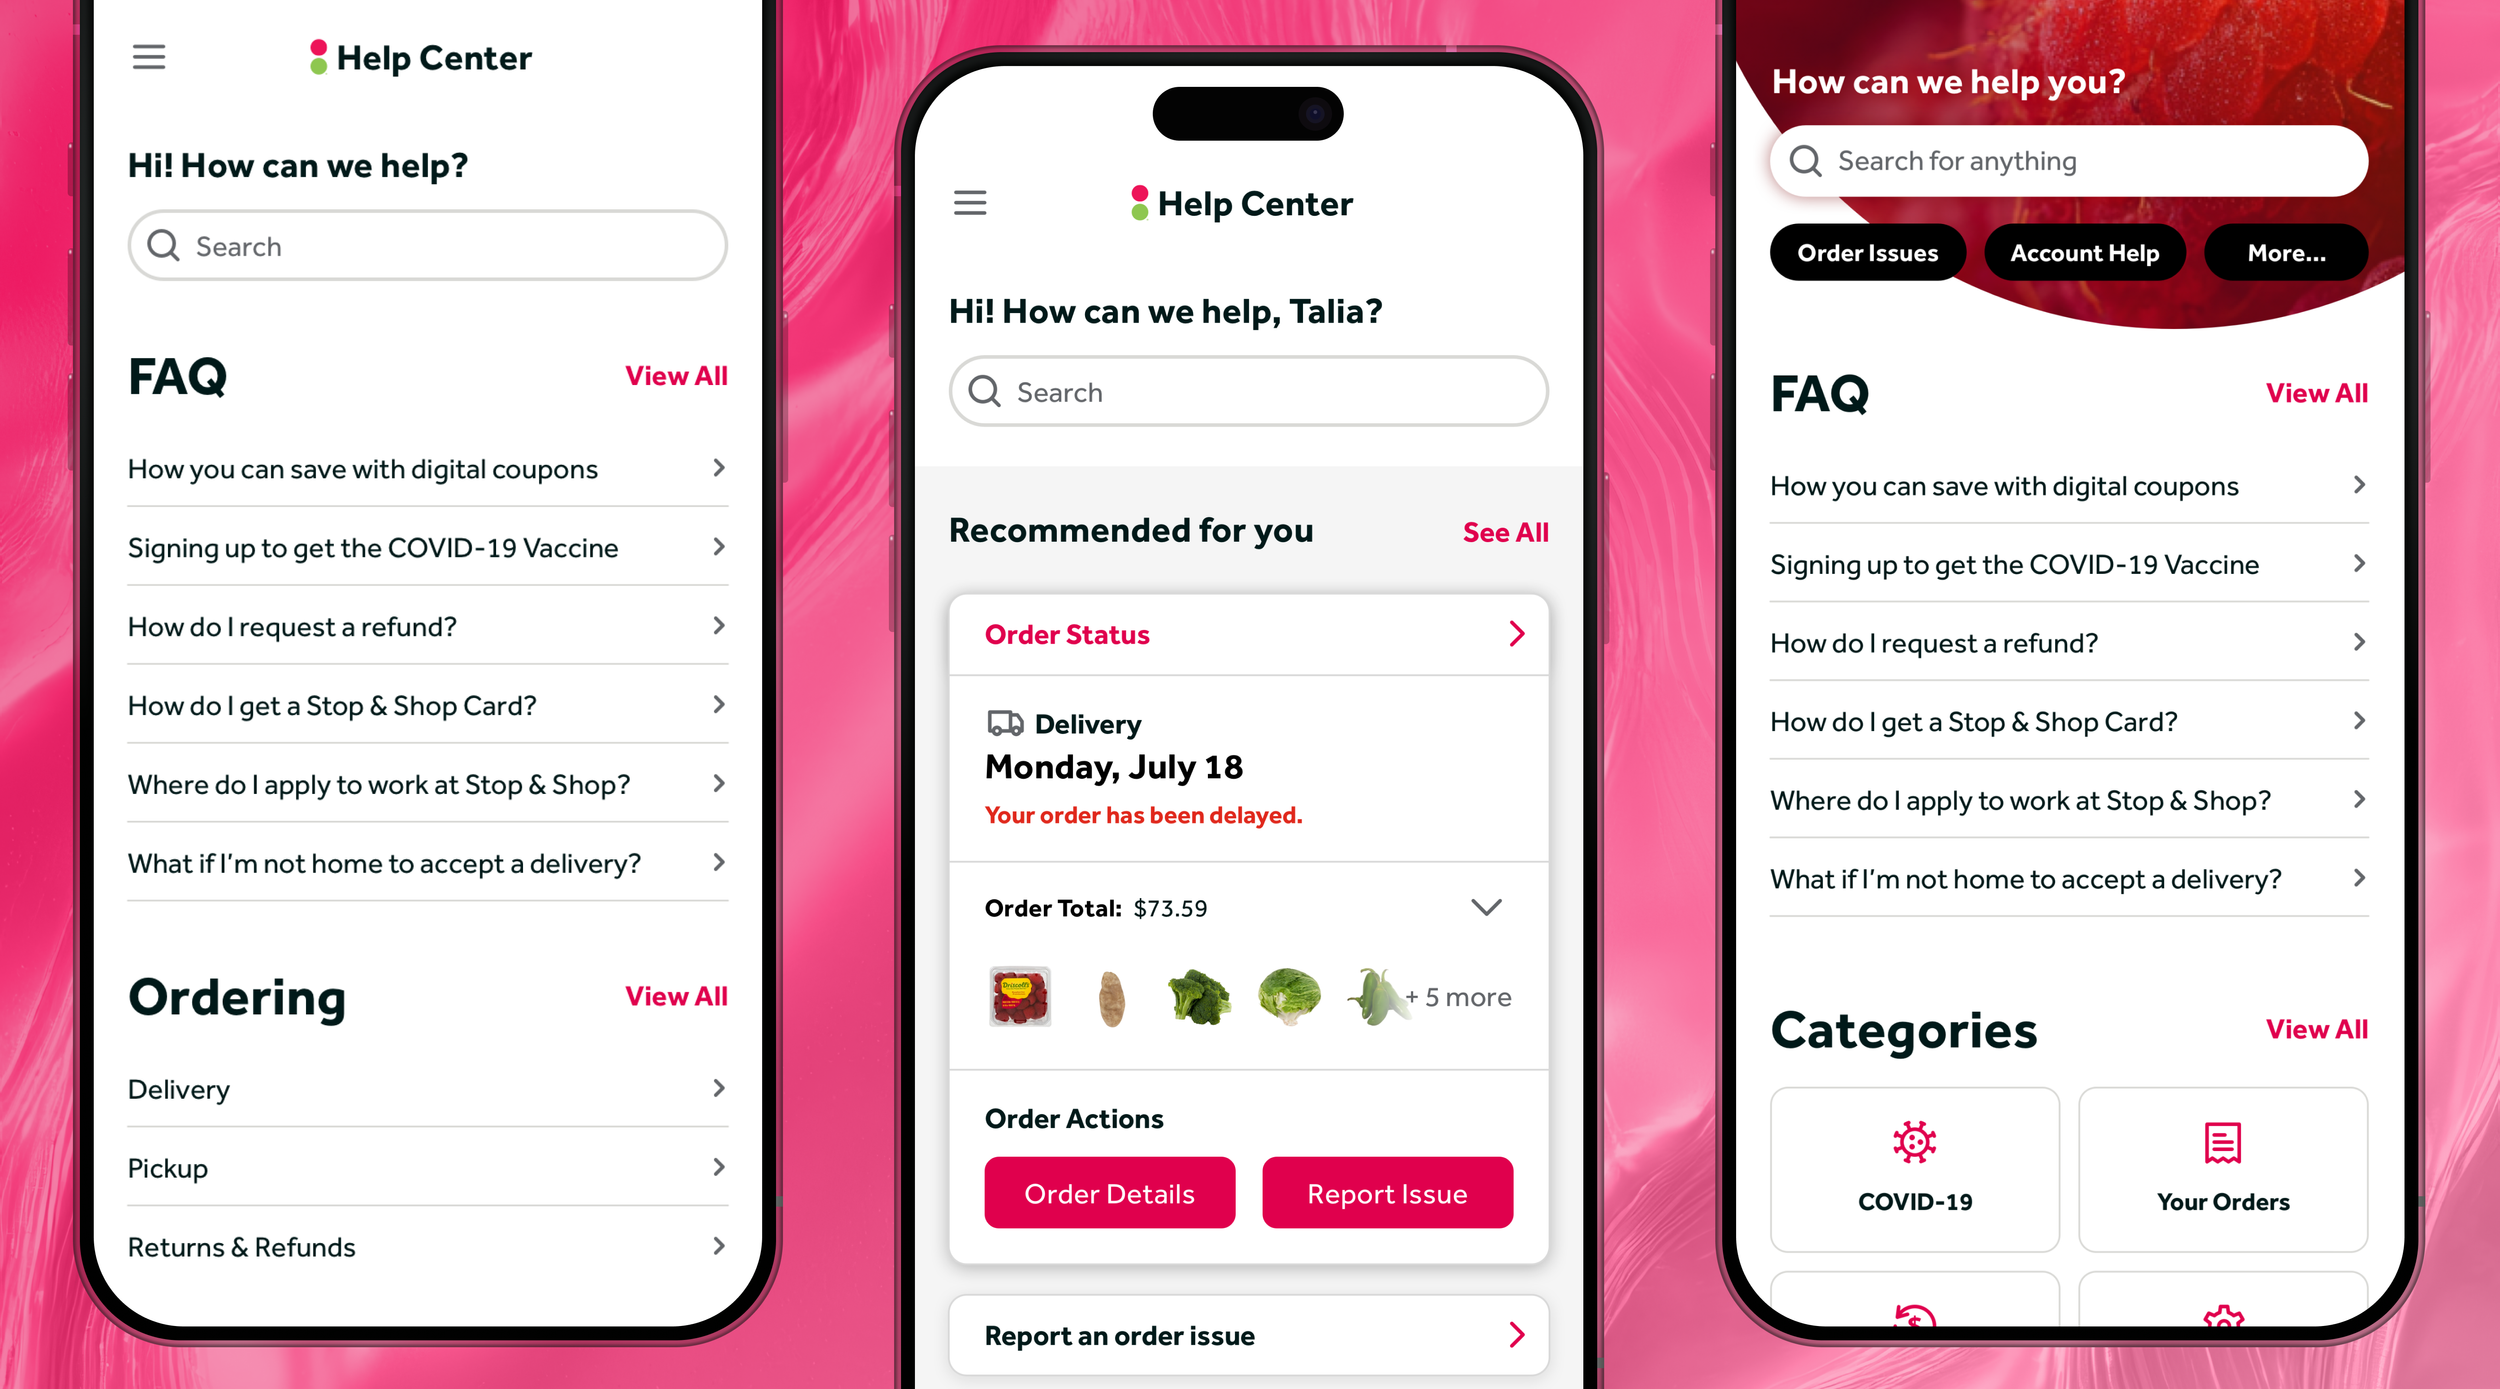
A new mobile help center experience gives customers clear information, faster than ever.
The Solution
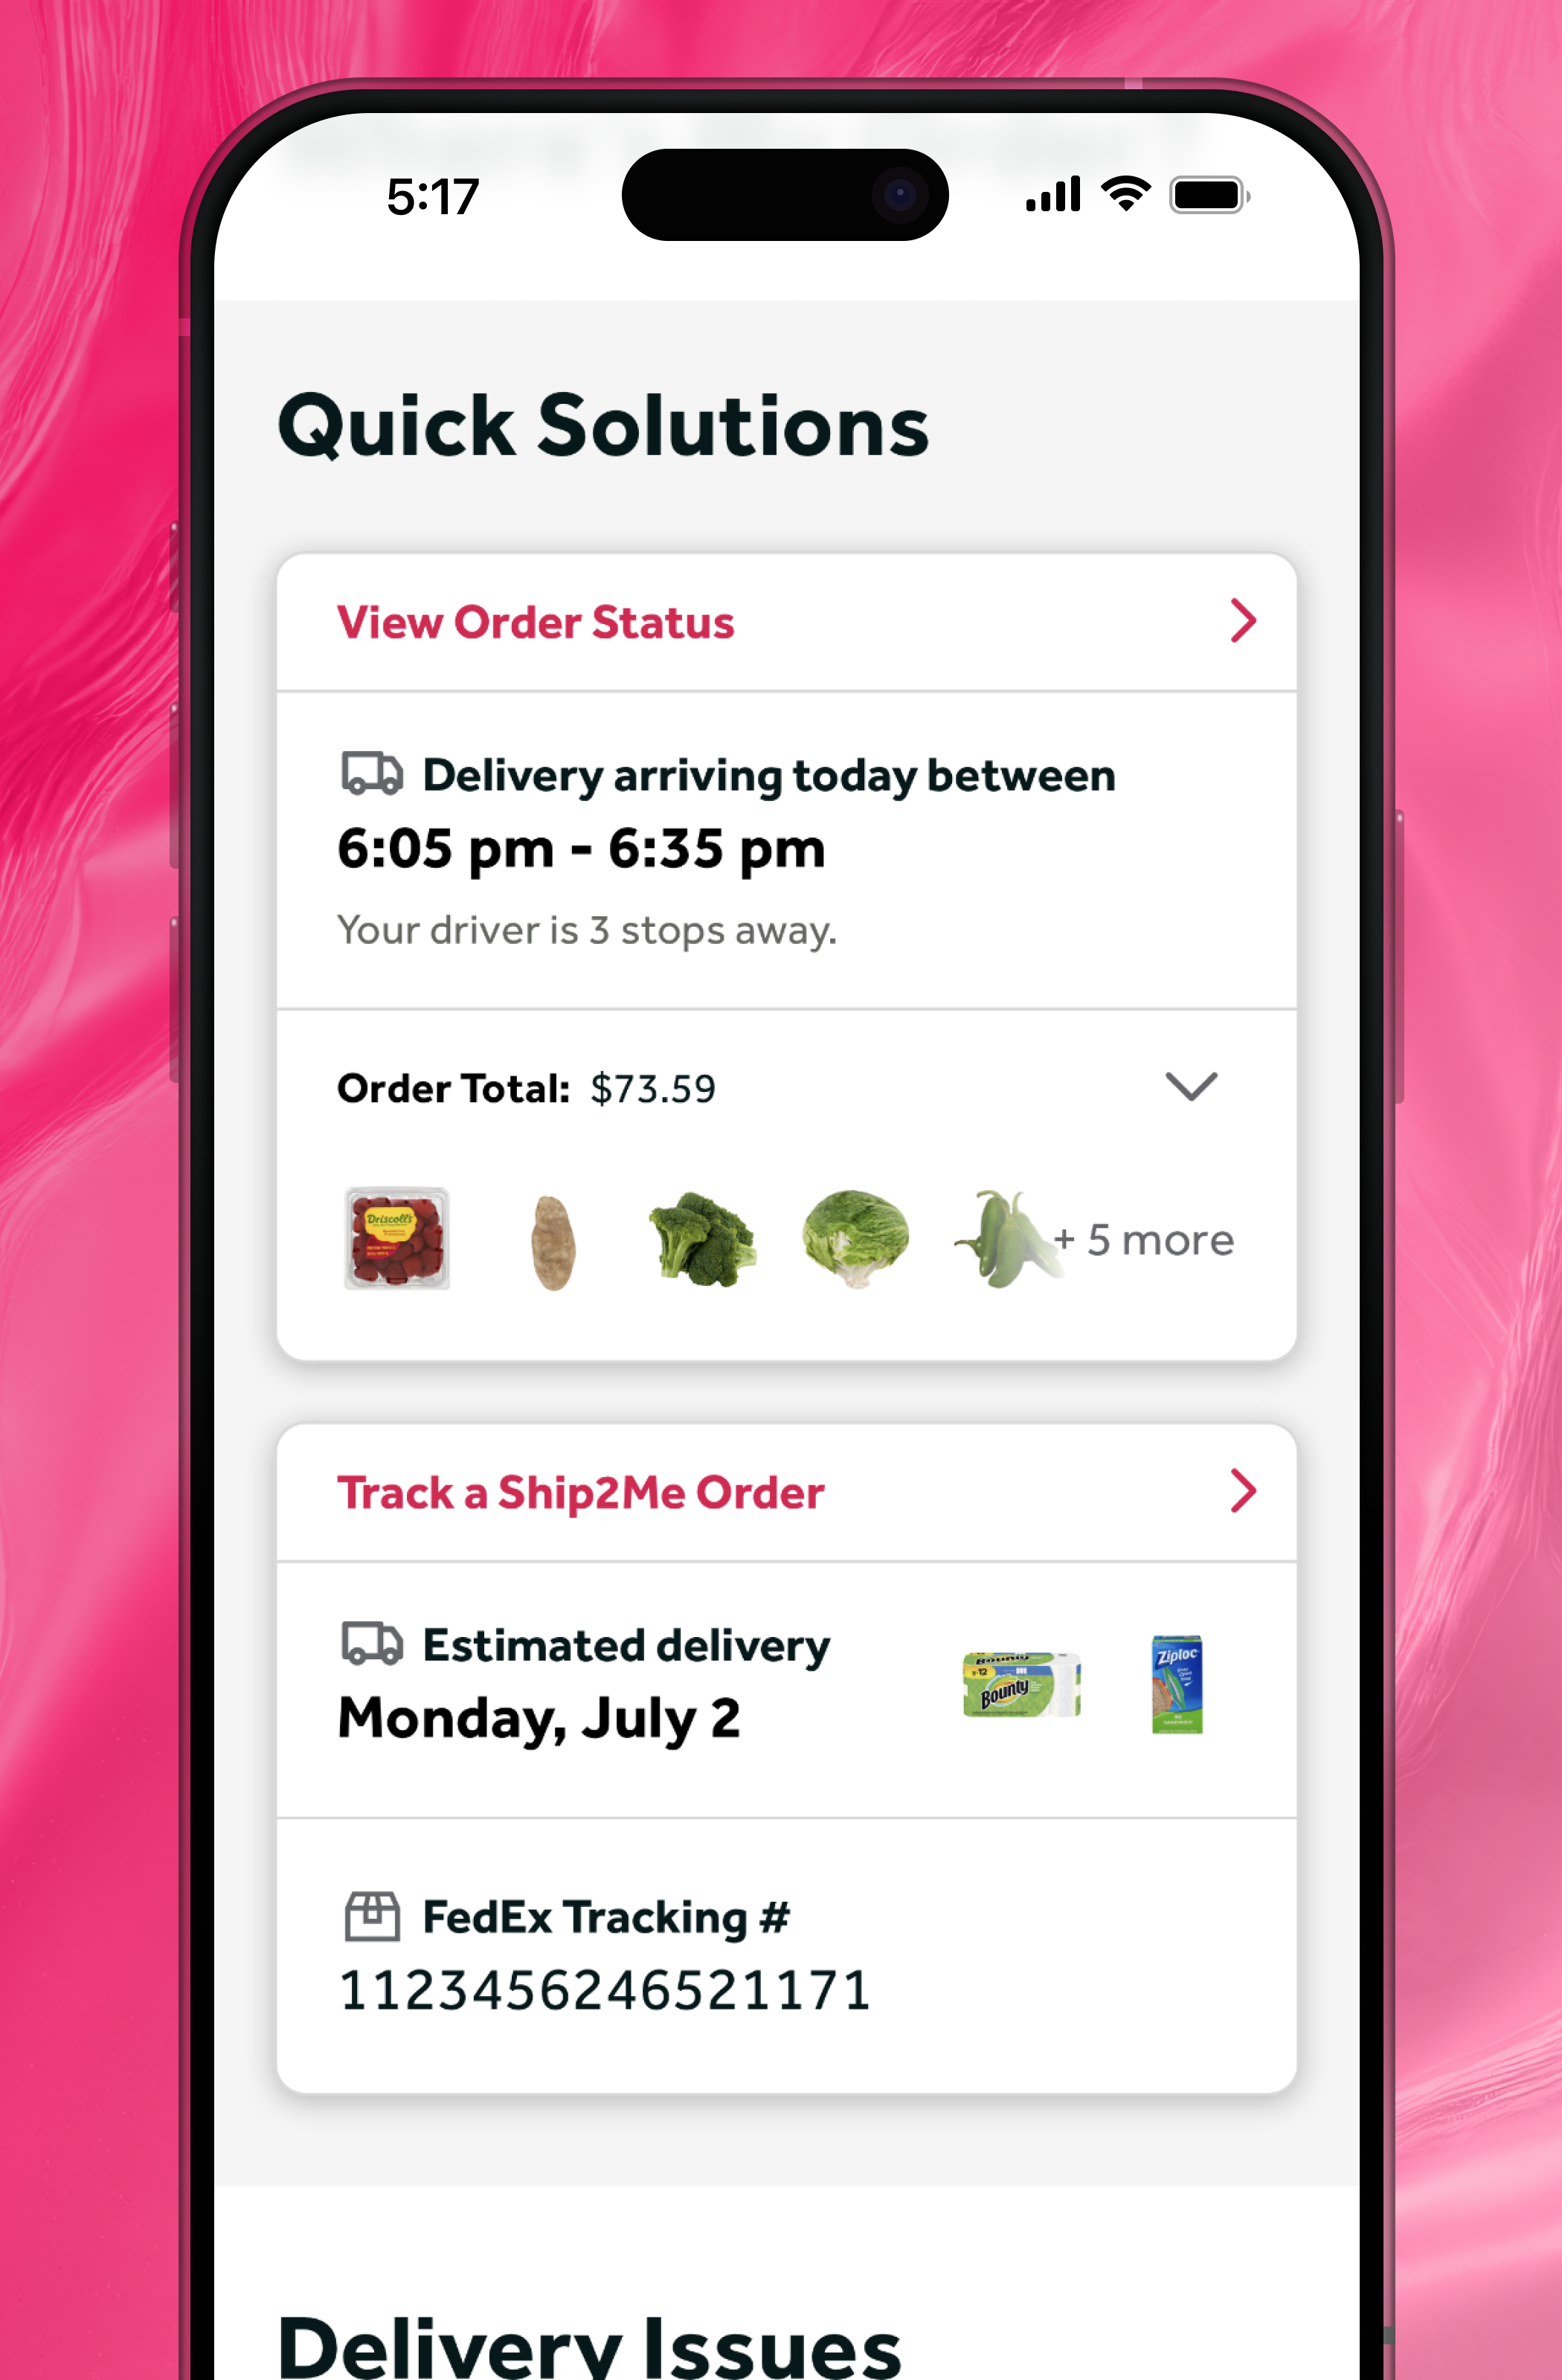
Your orders, up front. Right on the homepage.
Easy to read, step-by-step help, related information right where you need it — and access to customer service on every page.
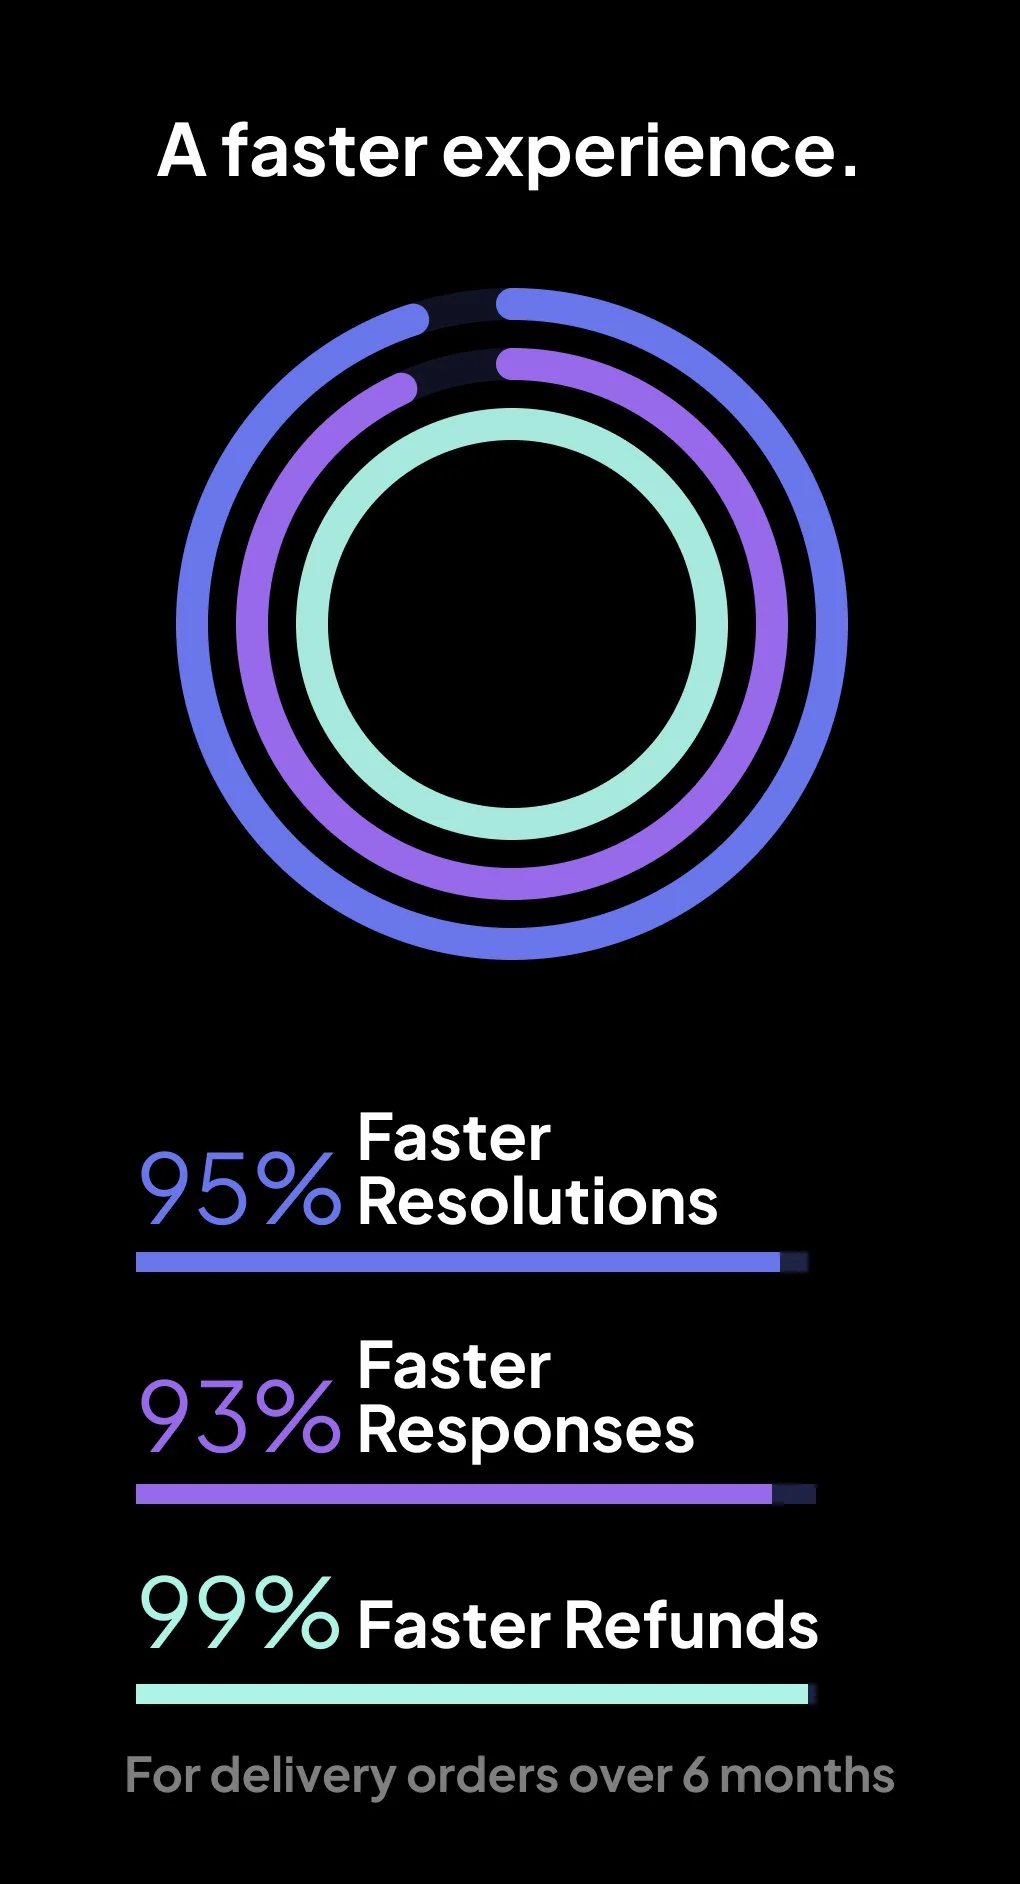
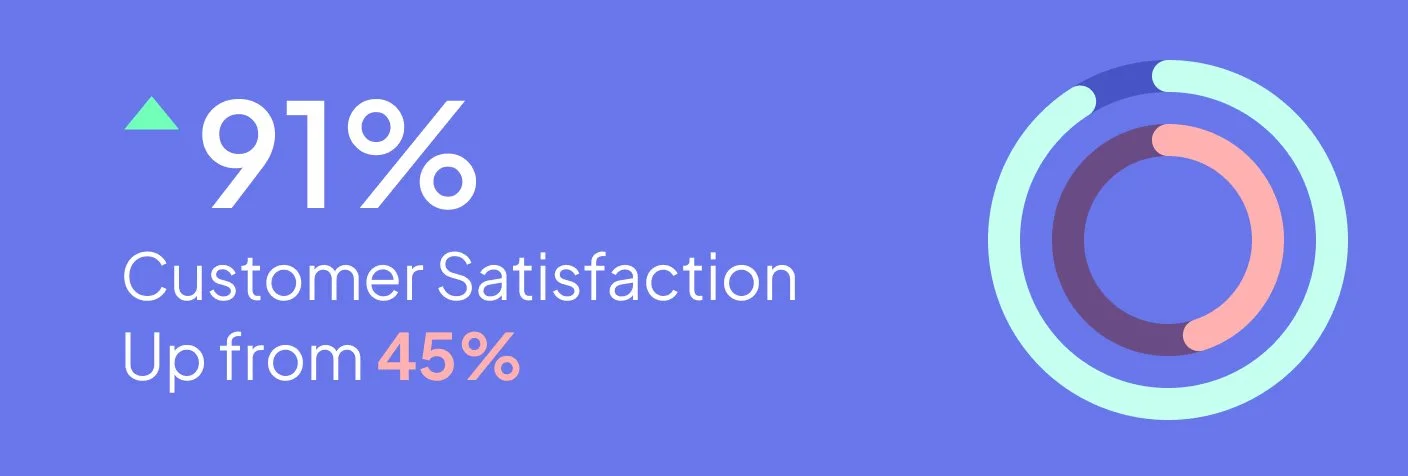
We tested 3 solutions, and used data to improve CSAT by over 100%. We interviewed & surveyed over 1,000 customers.
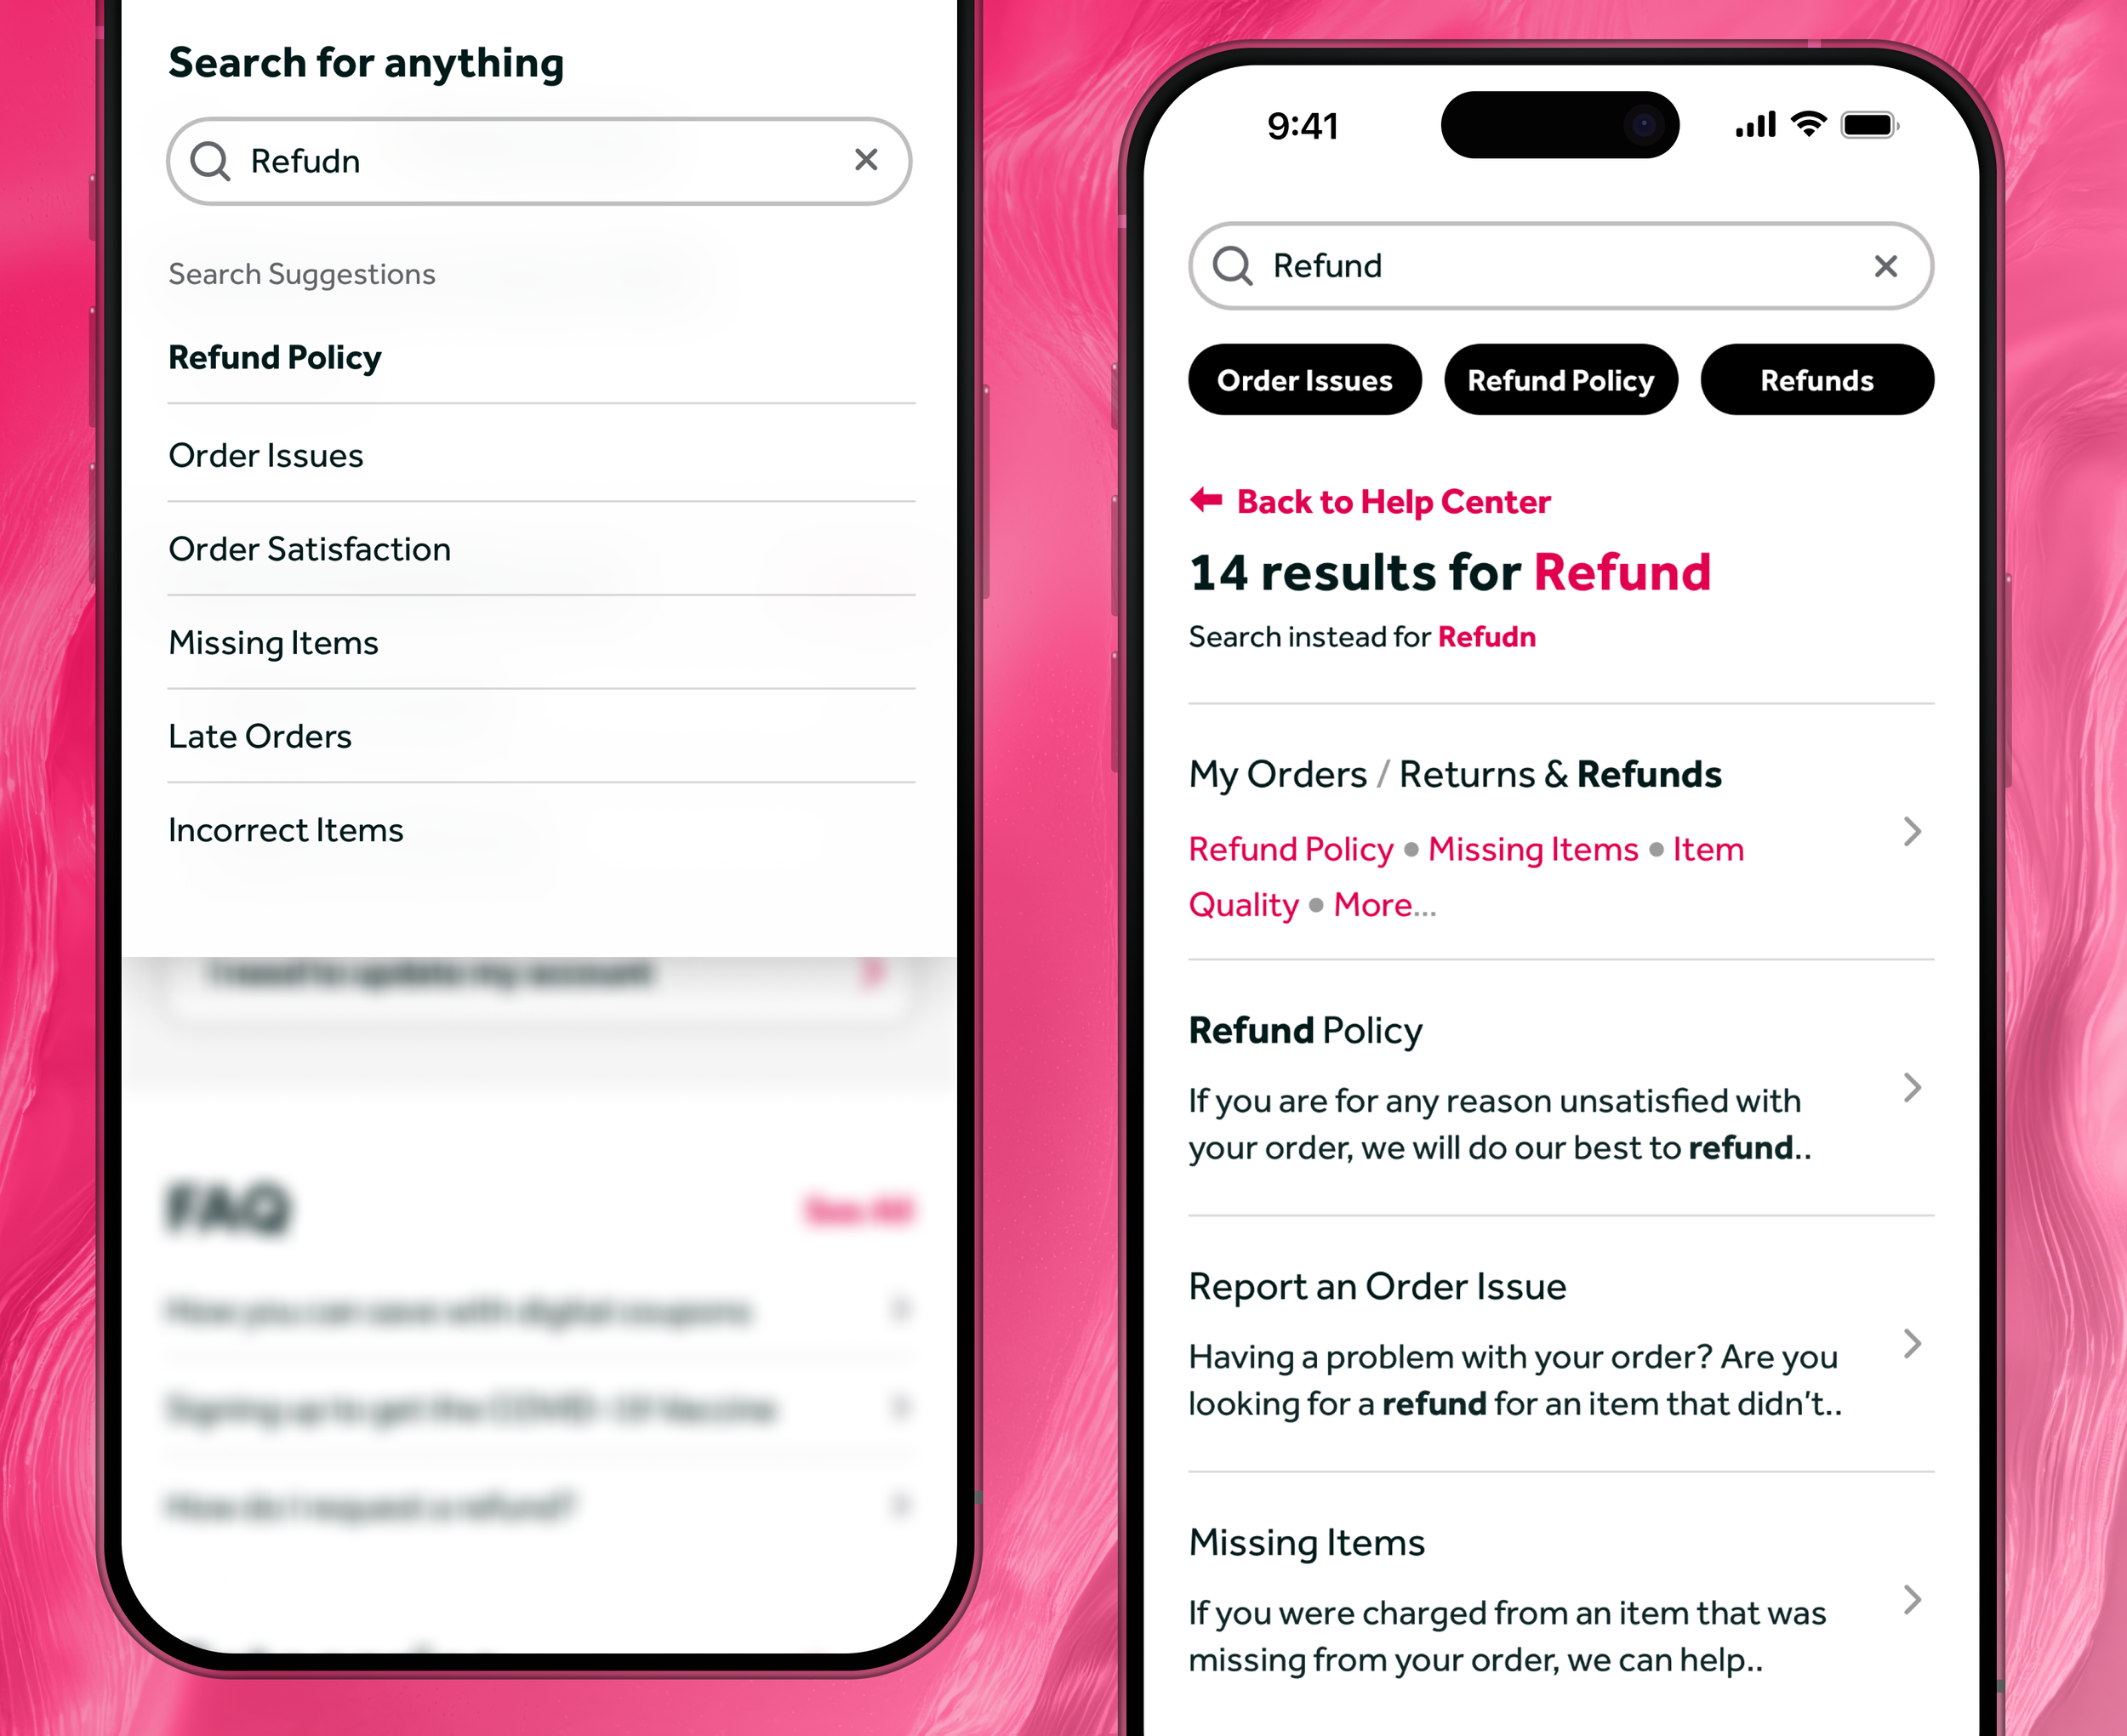
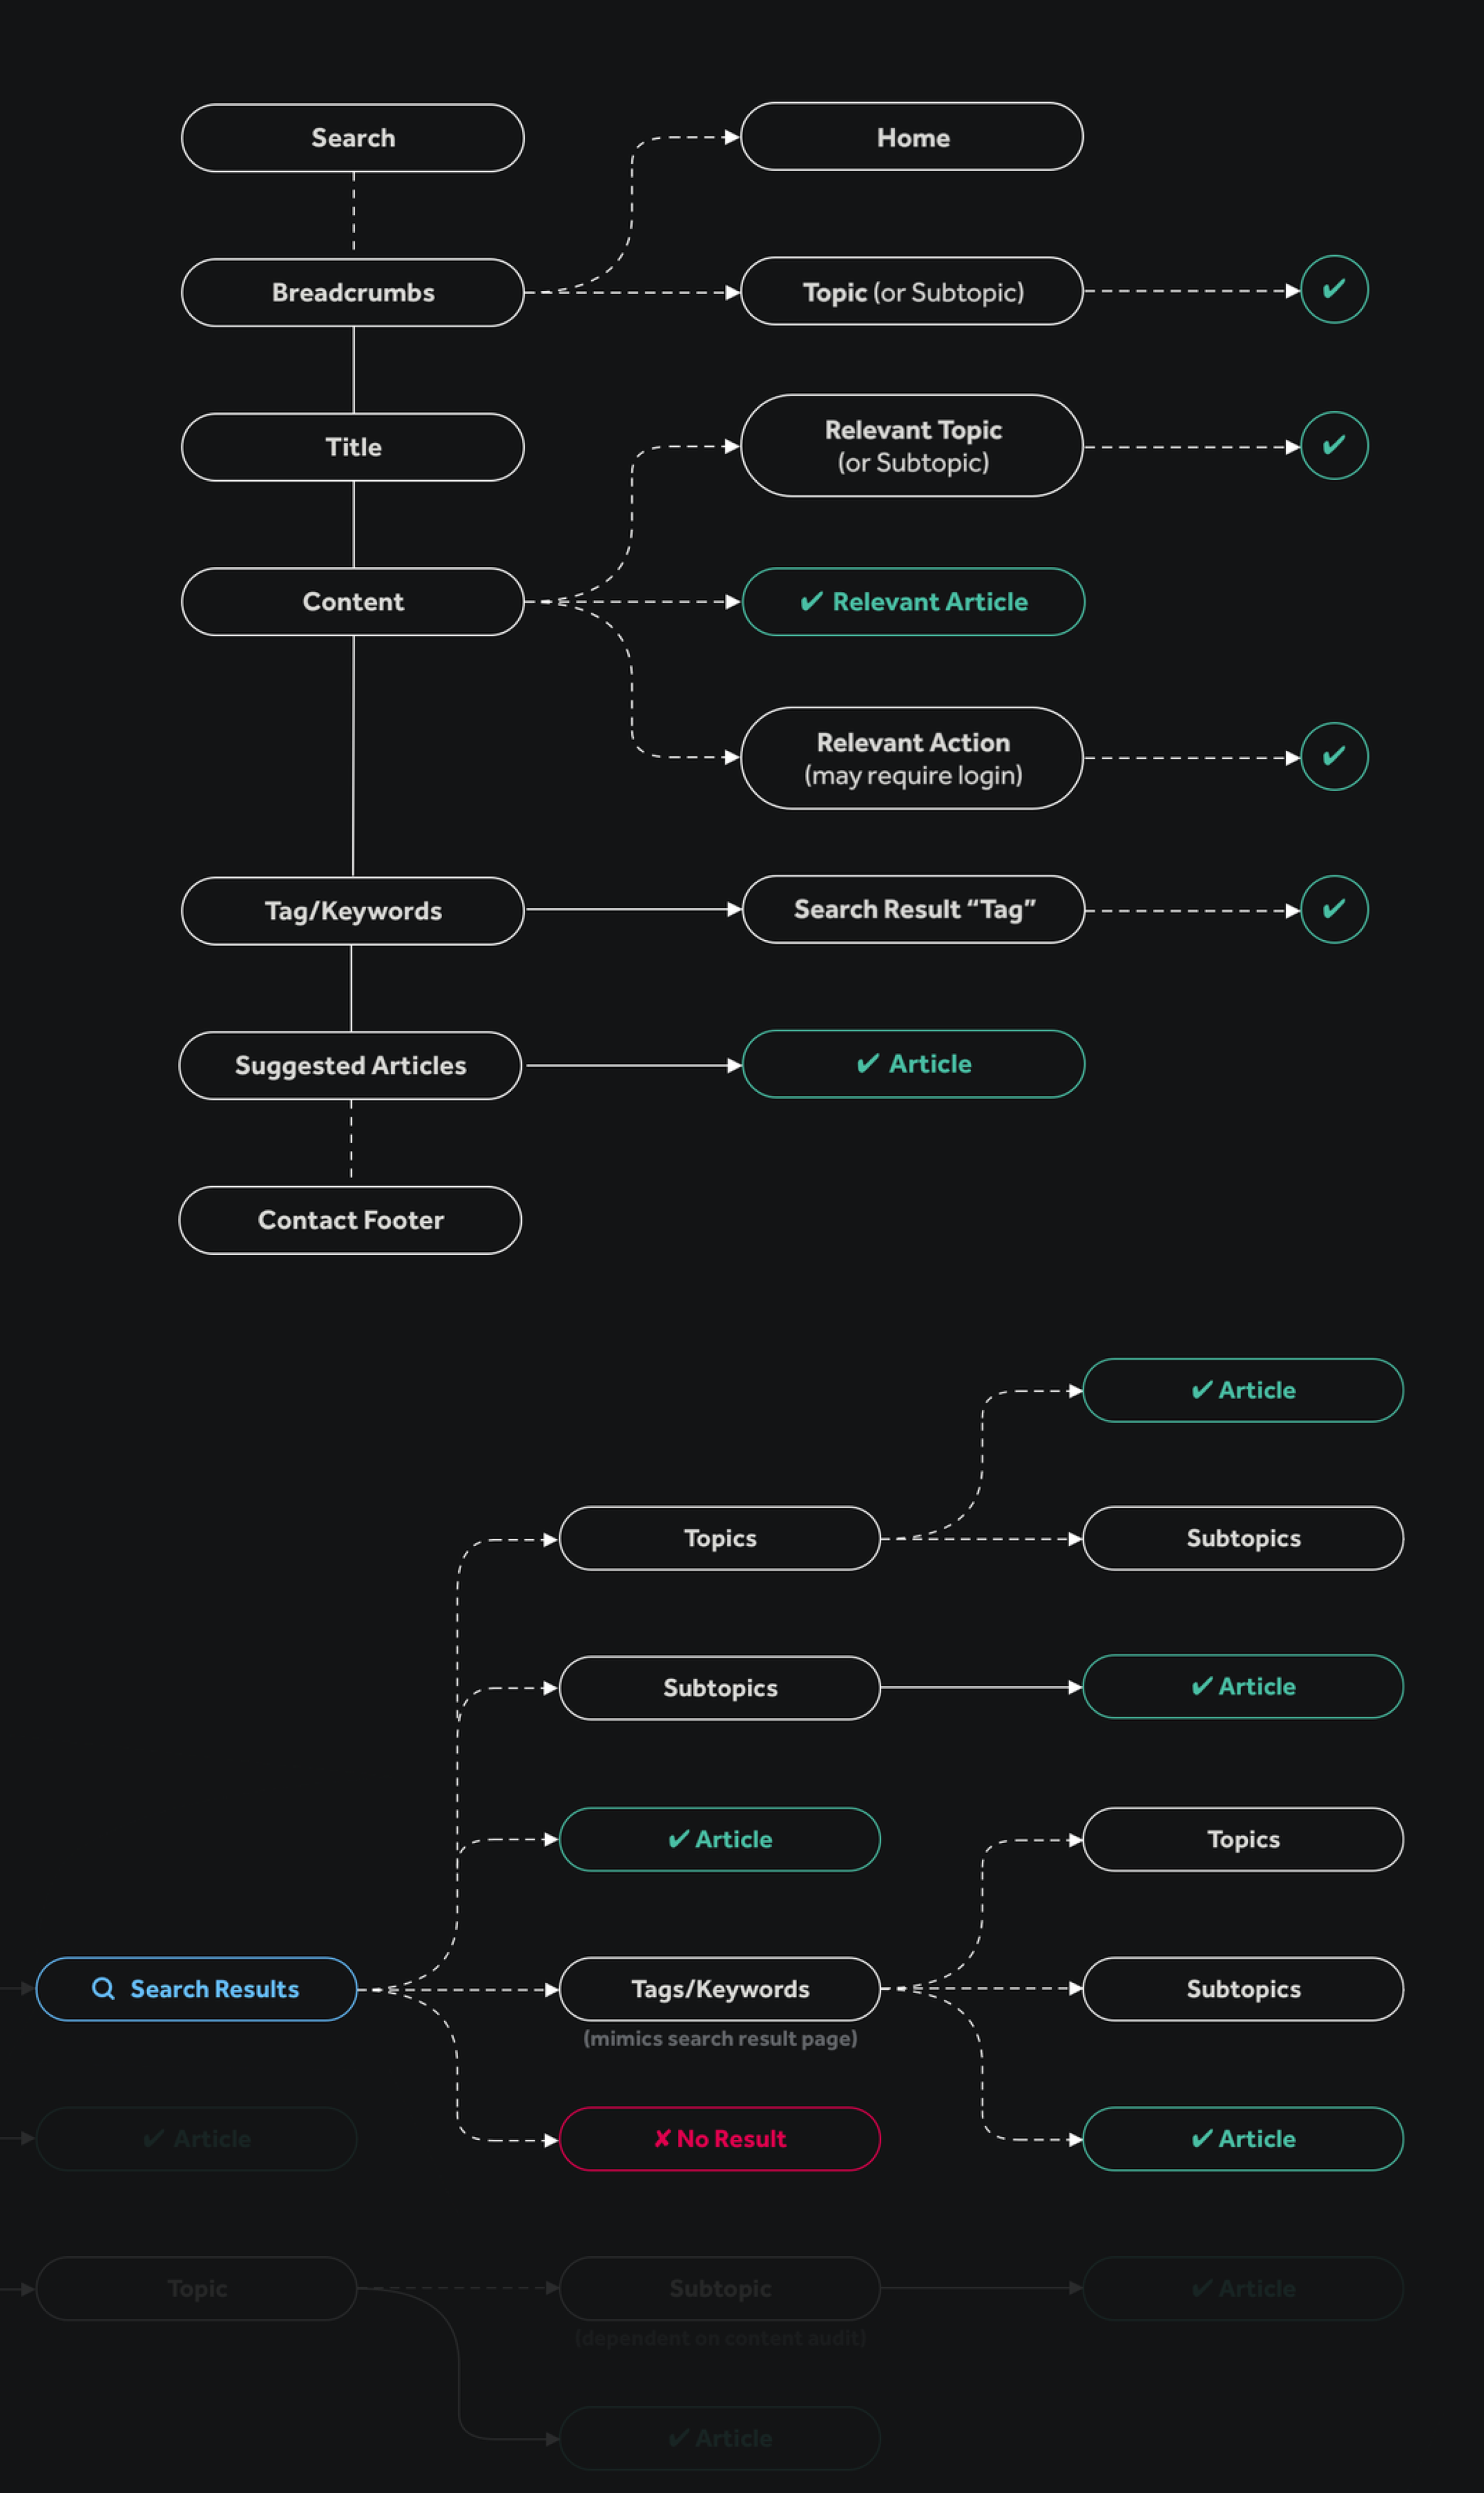
Smarter search. Using AI and insights to surface relevant articles, search results, and suggestions.
Feeling lazy? Just Google it. We made it SEO scrapable.
And we automated returns to meet demand. Increasing conversion, saving money, and retaining customers.
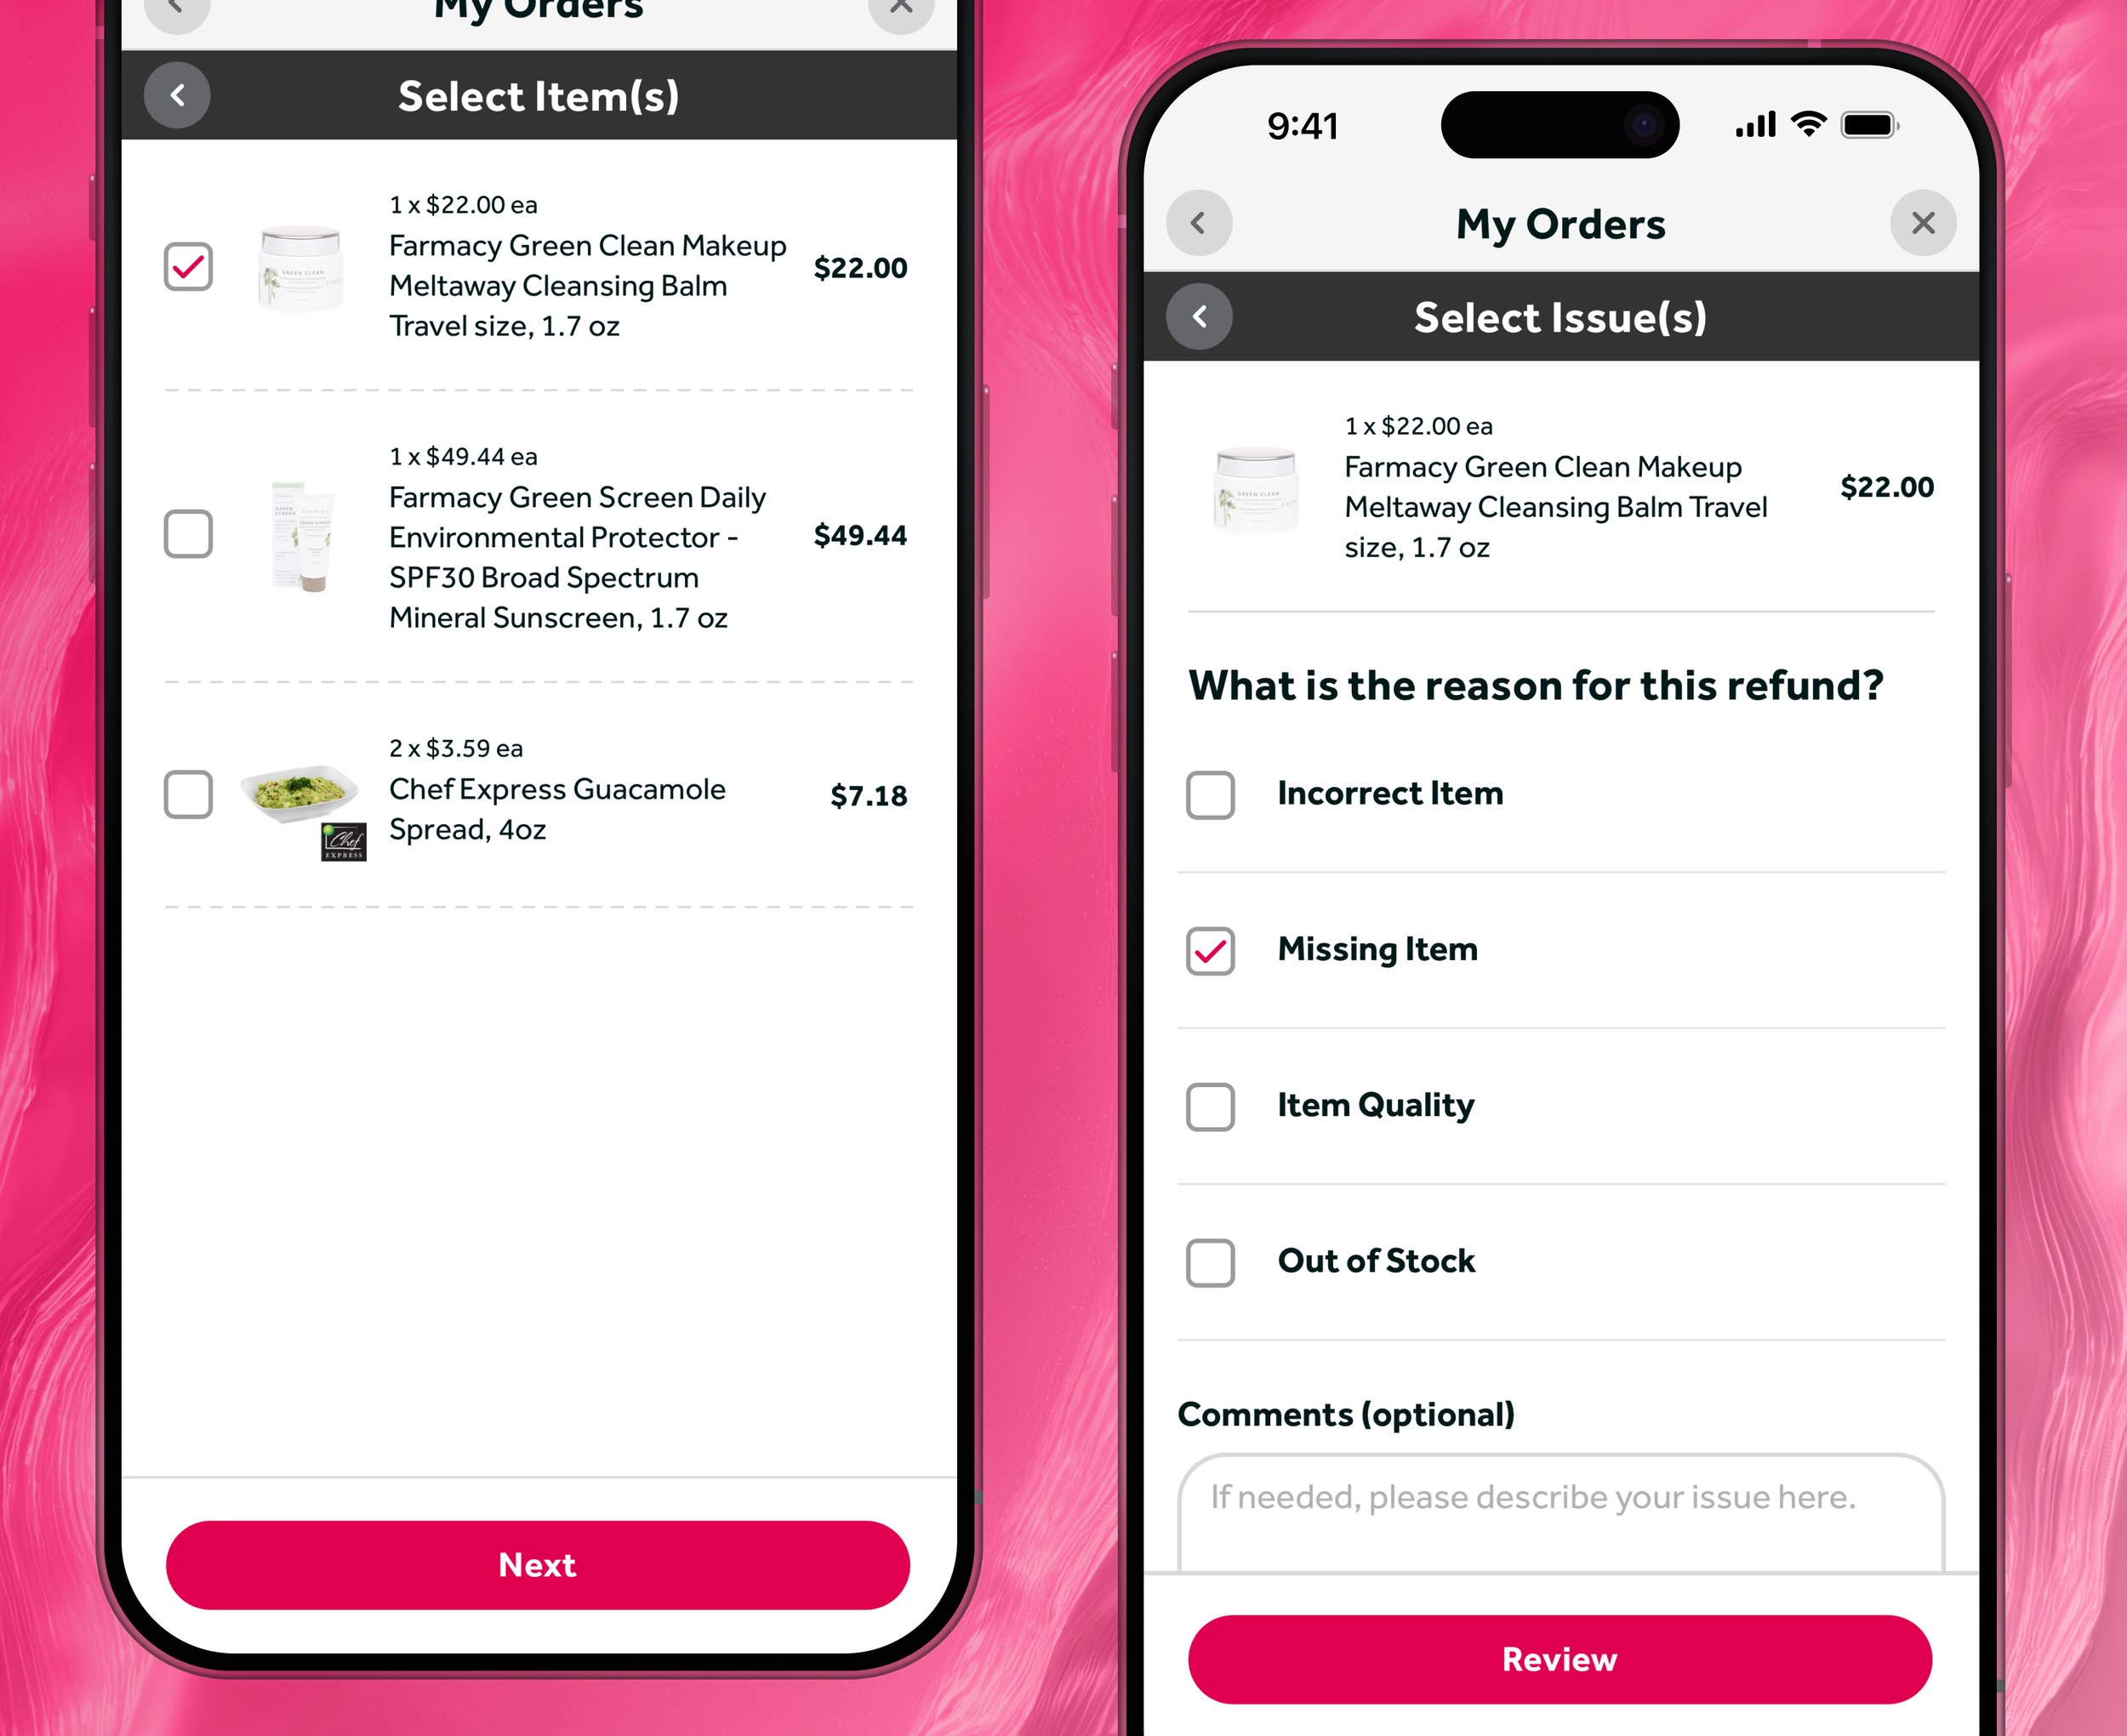
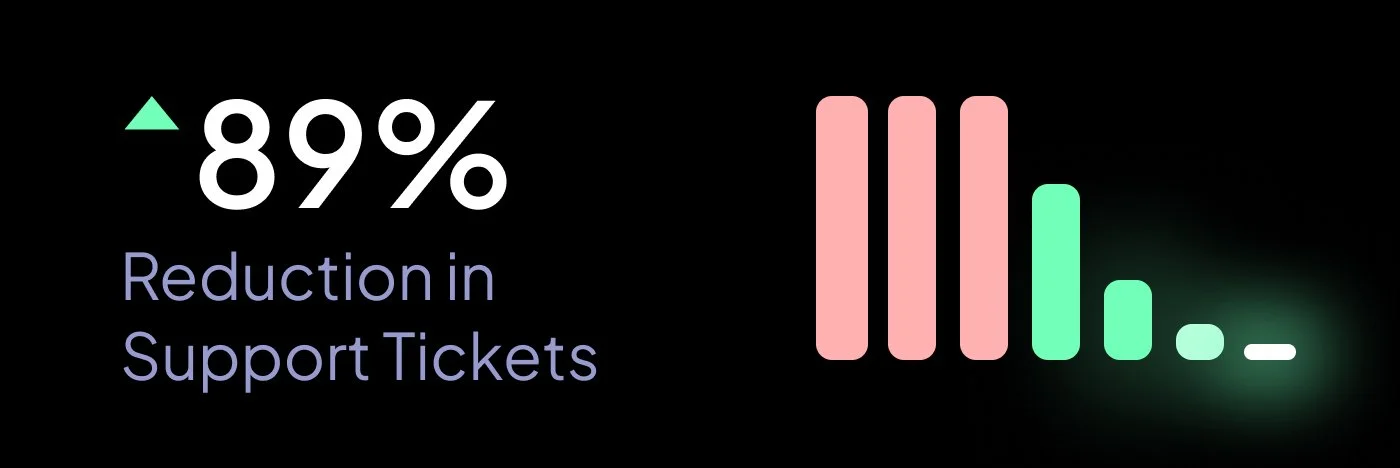
We built UX that reduces clicks, phone calls and support tickets.
Impact
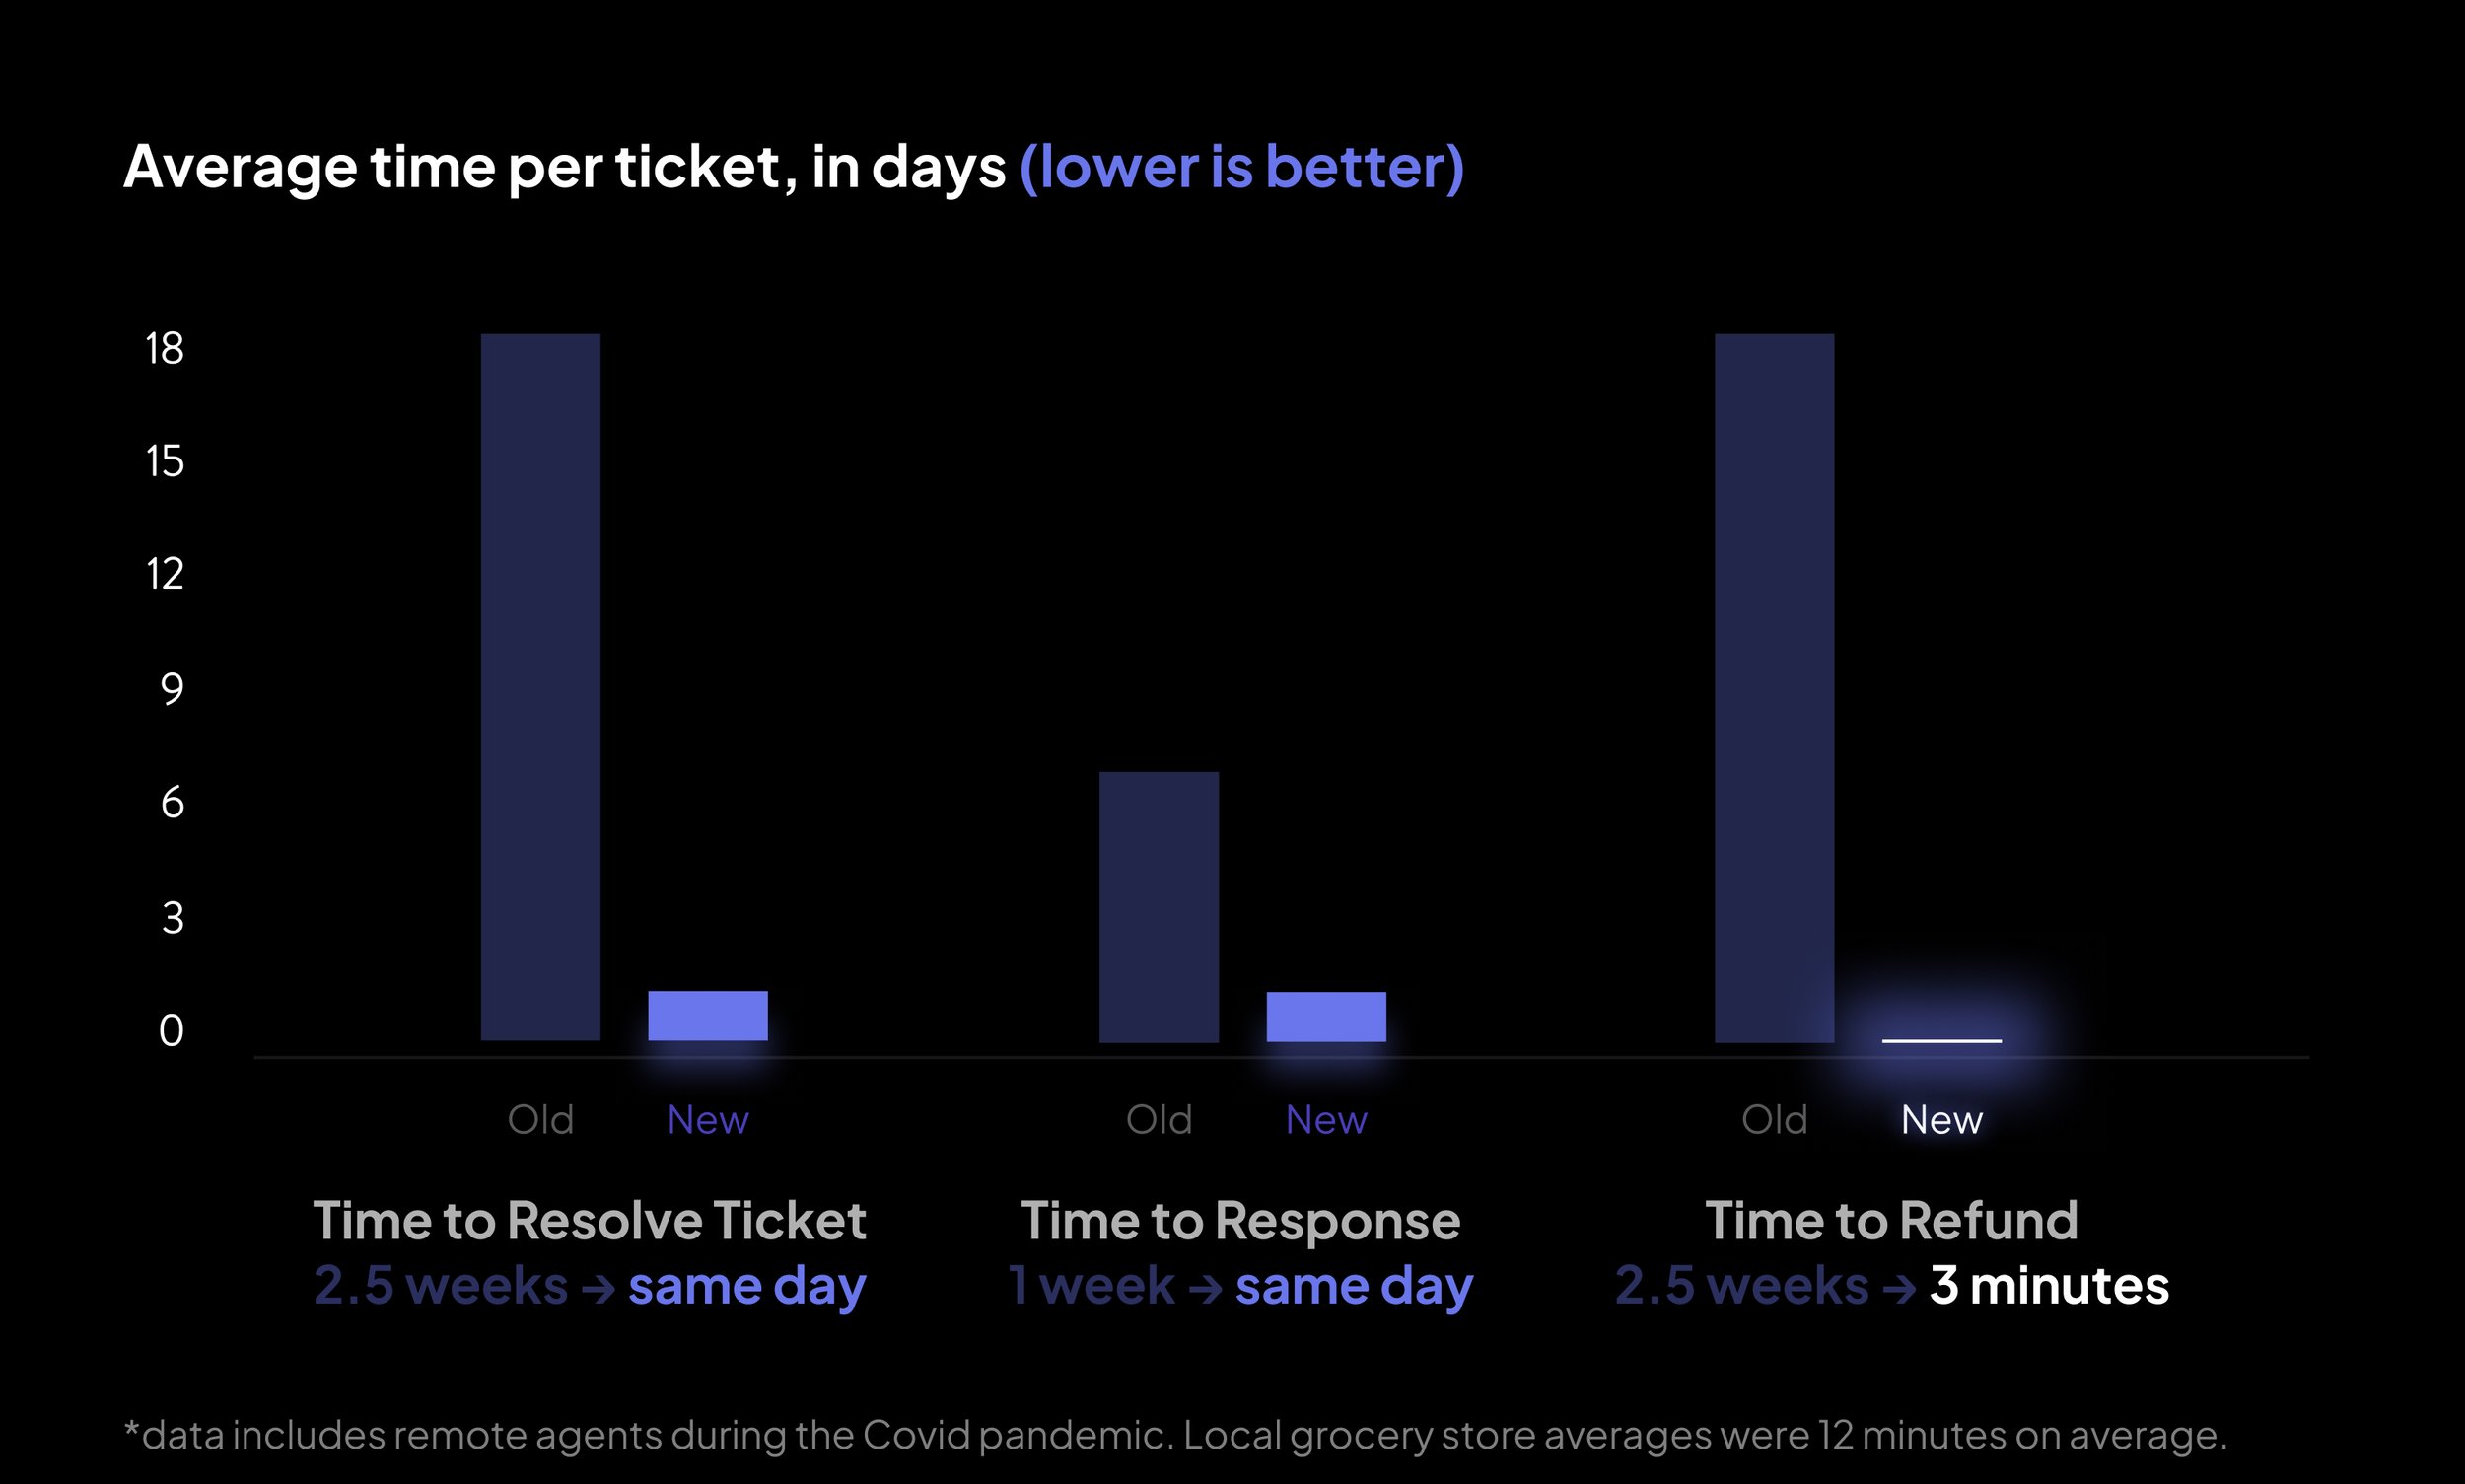

*data recorded over 12 month period, previous experience is 6 months leading up to launch and new is 6 months post launch.
I led the transformation of customer care for over 75 million annual customers online and in-store.
Through deep research, collaborative design, and scalable solutions, we turned a system that was rotten to the core into one that customers trust and depend on every day. When you focus on the right ingredients — real user needs, business pain points, and analyze your competitor’s success — you can create fresh experiences that last keep your customers coming back for more.